
Fig. 4
- ID
- ZDB-FIG-190718-44
- Publication
- Oralová et al., 2019 - Beyond the whole-mount phenotype: high-resolution imaging in fluorescence-based applications on zebrafish
- Other Figures
- All Figure Page
- Back to All Figure Page
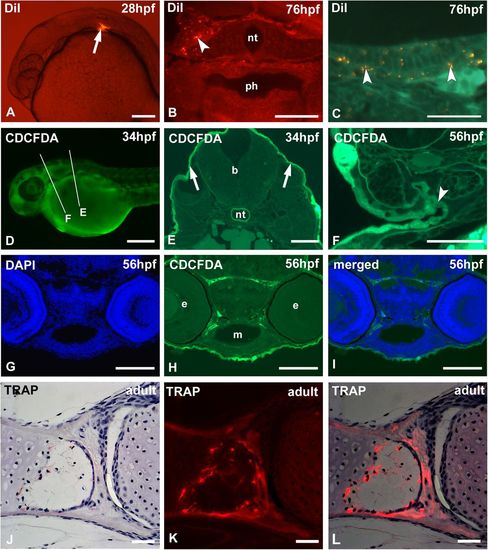
Cell tracking with fluorescent vital dyes and on-section histochemistry. (A–I) Cell tracking. (A,D) Whole-mount, (B,E) low- and (C,F) high-magnification cross sections. (A–C) WT zebrafish injected with DiI (A, arrow) at 28 hpf and euthanized after 48 h reveal areas of DiI distribution (arrowheads); the DiI label (yellowish dots) stands out sharply against an autofluorescent background (B,C). (D–F) WT zebrafish vital stained with CDCFDA. Only cells exposed to the solution (periderm) take up the stain (E, arrows). After a chase time of 22 h, labeled cells can be observed inside the forming gill slit (F, arrowhead). Lines in D indicate approximate level of sectioning in E,F. (G–I) DAPI staining (G) on section of CDCFDA labeled embryo (H) and merged picture (I). (J–K) On-section histochemistry for the osteoclast marker TRAP, showing the palatoquadrate and palatine bone in adult WT zebrafish, viewed in transmitted light (J), under epifluorescence (K) and the overlay of transmitted light and epifluorecence (L). b, brain; e, eye; m, mouth; nt, notochord; ph, pharyngeal lumen. Scale bars: (A,G,H,I) 100 µm; (D) 250 µm; (B,E,F) 50 µm; (C,J,K,L) 25 µm. |