
Fig. 2
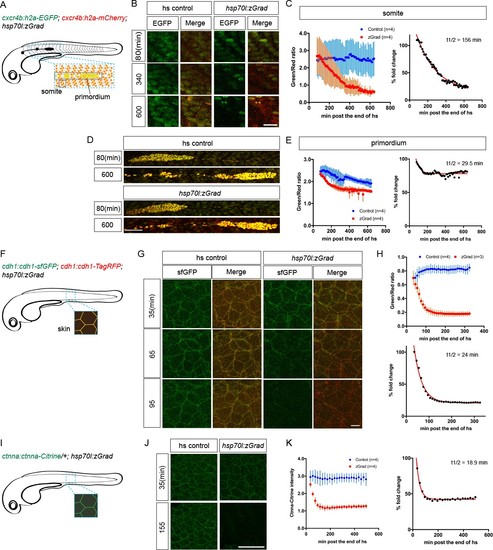
zGrad degrades nuclear, transmembrane and cytoplasmic proteins.(A) Schematic of strategy to assess zGrad-mediated H2A-EGFP degradation in the somites and the primordium. (B) Maximum-projected confocal images of nuclei in the somites in heat-shocked cxcr4b:H2A-EGFP; cxcr4b:H2A-mCherry embryos transgenic for hsp70l:zGrad (right) or not (left) at indicated time in min after the end of heat shock (29–30 hpf). Scale bar: 20 µm. (C) Left, quantification of H2A-EGFP-to-H2A-mCherry ratios in the somites of control (blue) and zGrad-expressing embryos (red) after the end of heat shock in min. Mean and SD are indicated. Right, H2A-EGFP-to-H2A-mCherry ratio of zGrad-expressing embryos normalized to control embryos (black dots) and fitted to a one-exponential decay model (red). (D) Maximum-projected confocal images of primordium nuclei in heat-shocked cxcr4b:H2A-EGFP; cxcr4b:H2A-mCherry embryos transgenic for hsp70l:zGrad (bottom) or not (top) at indicated time in min after the end of heat shock (29–30 hpf). Scale bar: 50 µm. (E) Left, quantification of H2A-EGFP-to-H2A-mCherry ratios in the primordia of control (blue) and zGrad-expressing embryos (red) after the end of heat shock in min. Mean and SD are indicated. Right, H2A-EGFP-to-H2A-mCherry ratio of zGrad-expressing embryos normalized to control embryos (black dots) and fit to a one-exponential decay model (red). (F) Schematic of strategy to assess zGrad-mediated Cdh1-sfGFP degradation in the skin (enveloping and epidermal basal layer). (G) Maximum-projected confocal images of the skin in heat-shocked cdh1:cdh1-sfGFP; cdh1:cdh1-TagRFP embryos transgenic for hsp70l:zGrad (right) or not (left) at indicated time in min after the end of heat shock (31 hpf). Scale bar: 10 µm. (H) Top, quantification of Cdh1-sfGFP-to-Cdh1-TagRFP ratios in the primordia of control (blue) and zGrad-expressing embryos (red) after the end of heat shock in min. Mean and SD are indicated. Bottom, Cdh1-sfGFP-to-Cdh1-TagRFP ratio of zGrad-expressing embryos normalized to control embryos (black dots) and fit to a one-exponential decay model (red). (I) Schematic of strategy to assess zGrad-mediated Ctnna-Citrine degradation in the skin. (J) Maximum-projected confocal images of skin cells in heat-shocked ctnna:ctnna-Citrine/+ embryos transgenic for hsp70l:zGrad (right) or non-hsp70l:zGrad transgenic controls (left) at indicated time in min past the end of heat shock (31 hpf). Scale bar: 50 µm. (K) Left, quantification of Ctnna-Citrine levels in the skin of control (blue) and zGrad-expressing embryos (red) after the end of heat shock in min. Mean and SD are indicated. Right, Ctnna-Citrine levels in zGrad-expressing embryos normalized to Ctnna-Citrine levels in control embryos (black dots) and fit to a one-exponential decay model (red). |