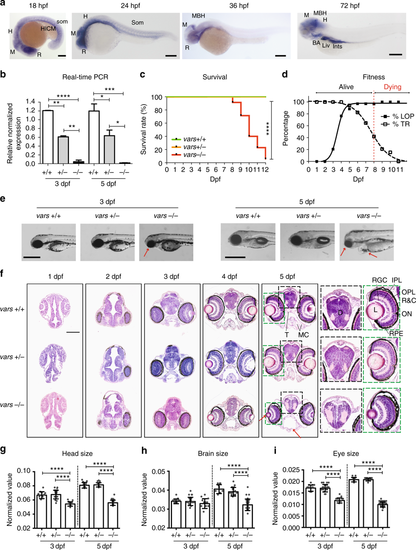
vars−/− larvae display severe developmental phenotype with early lethality. a Spatiotemporal expression patterns of vars by whole-mount RNA in situ hybridization at 18, 24, 36, and 72 hpf. BA Branchial Arches; H Hindbrain; HICM Hematopoietic Intermediate Cell Mass; Ints Intestine; Liv Liver; MBH Midbrain-Hindbrain boundary; M Midbrain; R Retina. Scale bars = 200 μm b RT-qPCR data demonstrating the expression of total vars in vars+/+, vars+/−, and vars−/− larvae at 3 and 5 dpf. Values are mean of three separate experiments performed in triplicate. c Kaplan–Meier survival curve of vars+/+ (n = 37), vars+/− (n = 82), and vars−/− (n = 34) larvae. d Graph illustrating changes in loss-of-posture and touch response of vars−/−larvae throughout the life span. Only the surviving larvae were included. e Representative lateral and dorsal bright-field images of 3 and 5 dpf vars+/+, vars+/−, and vars−/− larvae (scale bar, 500 μm). Pericardial edema, small eye, and periocular swelling around the eye were marked with arrows. f H&E histological staining of paraffin-embedded coronary sections from the forebrain of 1–5 dpf vars+/+, vars+/−, and vars−/− larvae (scale bar, 100 μm). Magnification of the disruption in the organization of the brain and the eye for 5 dpf vars+/+, vars+/−, and vars−/− was marked with black and green stripped line, respectively. Red arrows point out some structural abnormalities. D diencephalon; IPL inner plexiform layer; L lens; MC mandibular cartilage; ON optic nerve; OPL outer plexiform layer; R&C rods and cones; RGC retinal ganglion cell; T trabecula. g–i Comparison of the individual measurements for head size g, brain size h, and eye size i for vars+/+, vars+/−, and vars−/− at 3 dpf (n = 9, n = 20 and n = 11, respectively) and 5 dpf (n = 9, n = 14 and n = 24, respectively). In b and g–i one-way ANOVA with Tukey’s multiple comparisons test was used. Values are mean of three separate experiments. In c log-rank (Mantel-Cox) test was used. Error bars represent SD. Significant values are noted as ***p < 0.001 and ****p < 0.0001
|
