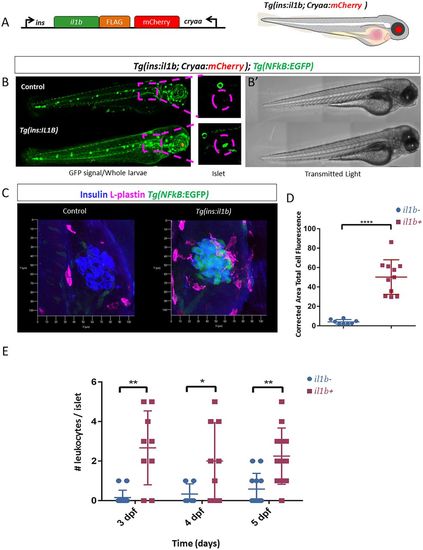
Generation of a genetic model of chronic β-cell inflammation in zebrafish. (A) Schematic representation of the genetic construct used to generate the transgenic model of chronic β-cell inflammation. The mature pro-inflammatory form of il1b was fused to the FLAG-peptide and cloned under the control of the insulin promoter. mCherry expression under the control of the crystalline (cryaa) promoter serves as a marker of transgenic animals (red eyes). (B) Representative confocal images (maximum projection) of Tg(NF-kB:GFP) larvae at 3 dpf in the presence or absence of il1b expression in β-cells. The top panel shows a control larva, whereas the bottom panel shows a Tg(ins:il1b) larva. The insets show high-magnification images of the islet region. There is strong GFP expression in the islets of Tg(ins:il1b) larvae compared to controls. Note that Tg(ins:il1b) larvae tend to exhibit higher GFP expression in the whole body compared to controls. (B′) Bright-field images of the larvae shown in B. Imaging in B was performed using tile-scan and the individual frames were automatically stitched together using the Tiles tool in the ZEN software (Zeiss) to render the entire larvae. (C) Representative confocal images of the primary islets from control and Tg(ins:il1b) larvae at 4 dpf in the transgenic background of a Tg(NF-kB:GFP) reporter (green). Immunostaining against insulin (blue) and L-plastin (magenta) marks the β-cells and the leukocytes, respectively. The islet from Tg(ins:il1b)larvae exhibits an increase in NF-kB:GFP expression compared to controls and the presence of leukocytes in the islet region. (D) Quantification of corrected area total cell fluorescence of NF-kB:GFP in the islets of control (blue) and Tg(ins:il1b) (red) larvae. Unpaired two-tailed t-test (Welch's correction), ****P<0.0001, mean±s.d. (E) Quantification of the number of leukocytes within the islet region of Tg(ins:il1b) (red) larvae compared to WT (blue) at 3, 4 and 5 dpf. Unpaired two-tailed t-test with Welch's correction, *P<0.05, **P<0.01, mean±s.d.