
Fig. 3
- ID
- ZDB-FIG-190606-35
- Publication
- Patowary et al., 2019 - Family-based exome sequencing and case-control analysis implicate CEP41 as an ASD gene
- Other Figures
- All Figure Page
- Back to All Figure Page
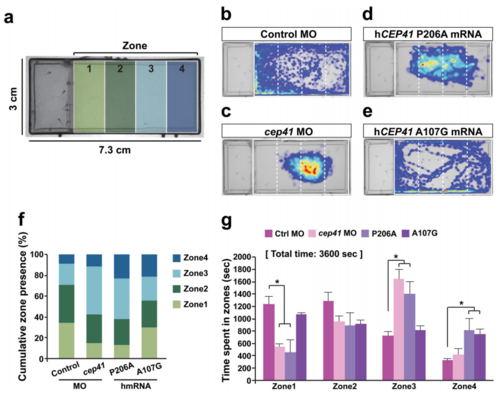
a A diagram of experimental chamber indicating the zones for the analysis of target location. b–e Heatmap showing the cumulative location of each 5–6 dpf control MO, cep41 MO and human CEP41 P206A and A107G mRNA injected target zebrafish larvae during 1 h experiment. f Quantified data presenting the percentage of time spent in each zone during 1 h experiment. g The statistical analysis of the time target larvae spent in each zone. The cep41 MO and P206A larvae spend decreased amount of time in zone 1 adjacent to the group. The data are shown as the mean ± SD; *p < 0.05 (Student’s t-test). All data are representative of at least five independent experiments |
| Fish: | |
|---|---|
| Knockdown Reagent: | |
| Observed In: | |
| Stage Range: | Day 5 to Day 6 |