|
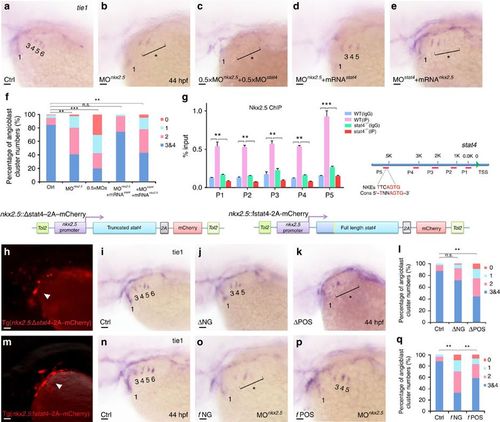
Cell-autonomous requirement of Stat4 downstream of Nkx2.5. (a–e) In situ hybridization analysis of tie1 transcripts in the control (a), nkx2.5 morphant embryos (b), embryos with half doses of nkx2.5 and stat4 morpholinos (c), nkx2.5 morphants with stat4 mRNA (d) and stat4 morphants with nkx2.5 mRNA (e). (f) Proportional quantification of embryos with defective angioblastic cords, Kruskal–Wallis test with the Dunn’s multiple comparison test, **P<0.01, ***P<0.001, n.s.: P>0.05, n≥30 per each group. (g) The ChIP analysis with anti-Nkx2.5 antibody for the promoter regions of stat4 in the wild-type and stat4 mutants at 44 hpf across six experimental replicates (n=30 embryos/replicate in each group, Kruskal–Wallis test with the Dunn’s multiple comparison test, **P<0.01, ***P<0.001). The binding enrichment region at the stat4 locus is indicated by primers (P1–P5). The minimal DNA-binding consensus (Cons) for Nkx2.5 contains a 5'-TNNAGTG-3' sequence motif. (h,m) Cellular autonomous analysis of stat4 is carried out by utilizing an nkx2.5 promoter to generate chimeric embryos with transient truncated (Δ) and full-length (f) stat4 gene expression in nkx2.5+ cells. The schematic diagram shows tol2-mediated transient transgenesis of nkx2.5 promoting mCherry expression. (h) Specific mCherry fluorescence expresses as pharyngeal clusters in the transgenic embryos with nkx2.5 promoter driving variant N-terminal 51 amino-acids residues truncated zebrafish stat4. (m) Exclusive mCherry fluorescence in the pharynx is observed in the transgenic nkx2.5 promoter driving full-length wild-type form of zebrafish stat4 in nkx2.5 morphants embryos. (i–k) tie1+ PAA angioblastic cords are appraised by in situ hybridization in the controls (i), negative mCherry fluorescence expressing embryos (ΔNG) (j) and positive mCherry fluorescent embryos (ΔPOS). (l) Proportional quantification data. Kruskal–Wallis test with the Dunn’s multiple comparison test, **P<0.01, n.s.: P>0.05, n≥30 per each group. (n–p) The control (n), negative mCherry fluorescence expressing embryos with nkx2.5 MO (fNG) (o) and positive mCherry fluorescence expressing embryos with nkx2.5 MO (fPOS) (p). (q) Proportional quantification data, Kruskal–Wallis test with the Dunn’s multiple comparison test, **P<0.01, n≥30 per each group. Scale bars, 50 μm.
|