
Fig. 3
- ID
- ZDB-FIG-190404-17
- Publication
- Weijts et al., 2018 - Blood flow-induced Notch activation and endothelial migration enable vascular remodeling in zebrafish embryos
- Other Figures
- All Figure Page
- Back to All Figure Page
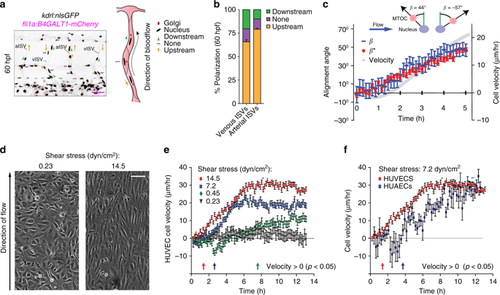
Upstream polarization and migration of ECs under flow. a Lateral images of zebrafish embryos with anterior side facing left. Orange arrows indicate the direction of blood flow through the ISVs. All ECs express nuclear-GFP and mCherry-fused marker of the Golgi. Planar polarization of ECs in ISVs is measured by the vector connecting the nucleus with the Golgi. Scale bar is 25 μm. b Quantification of EC planar polarization in venous and arterial ISVs (n = 10 embryos). c Positions of microtubule organization complexes (MTOCs) and nuclei in individual HUVECs and instantaneous velocities of HUVECs in a microfluidic perfusion chamber were monitored for 300 min after the exposure to flow with a shear stress of 7.2 dyn/cm2. Blue dashes show the values of the polarization angle, β, with 90° corresponding to polarization against the flow and β = −90°—polarization along the flow. Red circles show the values of the migration angle, β*, with 90° corresponding to migration against the flow and −90°—migration along the flow. Grey line (ordinate on the right) show the average cell migration velocity in the upstream direction. d Phase images from Supplementary Movie 6 showing confluent HUVECs after 10 h under laminar flow with shear stresses of 0.23 and 14.5 dyn/cm2. Scale bar is 100 µm. e Average velocities of upstream migration for HUVECs exposed to different shear stresses as functions of time after the inception of shear flow (n = 250 to 600 for individual shear stresses). f Average velocities of upstream migration as functions of time after the inception of shear flow (n = 250). Arrows at the bottom (colors correspond to those of the velocity data points) indicate the time points at which the migration of cells against the flow becomes statistically significant (average upstream velocity becomes positive with p < 0.05) |