
Fig. 1
- ID
- ZDB-FIG-190307-5
- Publication
- Treichel et al., 2018 - Development of an Embryonic Zebrafish Oligodendrocyte-Neuron Mixed Coculture System
- Other Figures
- All Figure Page
- Back to All Figure Page
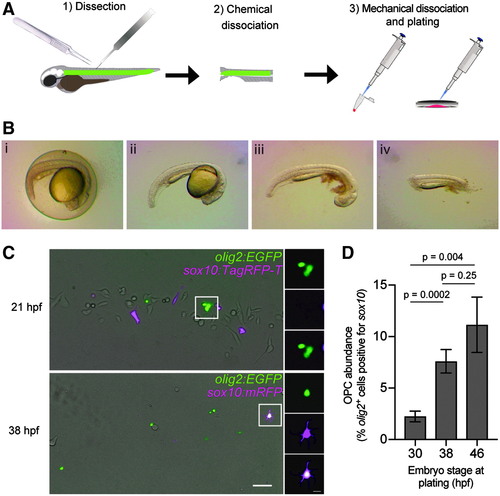
Primary culture of zebrafish OPCs. (A) Overview of approach for primary culture from 18 to 60 hpf transgenic embryos. (B) Dissection technique to culture spinal cord tissue proceeds from dechorionation (i→ii), to yolk removal (ii→iii), and is completed with anterior- and posterior-most segment removal (iii→iv). Anterior: right; dorsal: top. (C) Culture of Tg(sox10:TagRFP-T)/Tg(olig2:EGFP) embryos at 21 hpf and Tg(sox10:mRFP)/Tg(olig2:EGFP) double transgenic embryos at 38 hpf. Scale bars = 50 and 10 μm (inset). (D) Plot of percent olig2+ cells specified as OPCs identified by coexpression of sox10 based upon time of culture. N30 hpf = 14 dishes; N38 hpf = 13 dishes; N46 hpf = 11 dishes; with at least 8 nonadjacent fields counted per dish. Bars show mean ± SEM. One-way ANOVA, White's method. ANOVA, analysis of variance; OPCs, oligodendrocyte progenitor cells; SEM, standard error of the mean; hpf, hours postfertilization. |