
Fig. 2
- ID
- ZDB-FIG-190115-2
- Publication
- Sen et al., 2018 - Kat2a and Kat2b Acetyltransferase Activity Regulates Craniofacial Cartilage and Bone Differentiation in Zebrafish and Mice
- Other Figures
- All Figure Page
- Back to All Figure Page
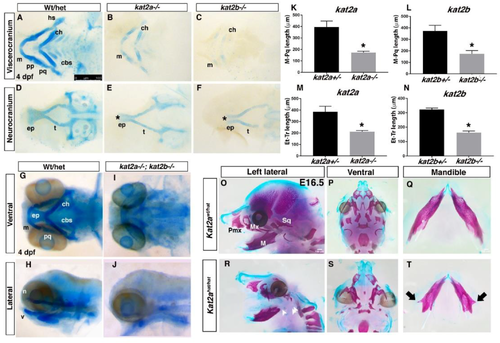
Loss of kat2a and kat2b causes defects in craniofacial development. Alcian blue staining to detect cartilage formation in 4 dpf (days post fertilization) wildtype/heterozygote zebrafish embryos (A,D,G,H), kat2a−/− (B,E), kat2b−/− (C,F), and kat2a−/−;kat2b−/− double mutant zebrafish embryos (I,J). (A–F) Cartilage-stained embryos were dissected to separate the viscerocranium and the neurocranium. As compared to the control (A,D), the flat-mounted 4 dpf kat2a (B,E) and kat2b (C,F) mutant larvae have a reduced palatoquadrate, including the pterygoid process of the palatoquadrate and the hyosymplectic of the viscerocranium, shortening of the Meckel’s cartilage, widening of the angle between ceratohyals in the viscerocranium, a smaller hypoplastic ethmoid plate, and deformed trabeculae of the neurocranium, with hypoplastic ceratobranchial cartilages that are also reduced in number. In the kat2a and kat2b mutant embryos, there is a gap in the anterior edge of the ethmoid plate that forms a “cleft” as shown (*) in (E,F). Cartilage defects were observed in n = 17/62 for kat2a and n = 16/66 for kat2b, with the total number of mutant embryos being n = 20/72 for kat2a and n = 17/70 for kat2b in each clutch. (G–J) Ventral and lateral views of whole-mount, alcian-blue-stained cartilage of control (G,H) and kat2a−/−;kat2b−/− double mutants (I,J). (K–N) Quantitation of length in micrometers (µm) from Meckel’s cartilage to palatoquadrate (M–Pq), and from ethmoid plate to trabeculae (Et–Tr), in kat2a and kat2b mutants shows a significant reduction in length. * denotes statistical significance (p < 0.05) using Welch’s T-Test. Error bars show the standard error of the mean. (O–T) Whole-mount E16.5 Kat2aWt/hat (O–Q) and Kat2ahat/hat (R–T) embryo skeletons stained with alcian blue for cartilage and alizarin red for bone. (O,R) Left lateral view of skull. (P,S) Ventral view of skull with the mandible dissected off. (Q,T) Dorsal view of the dissected mandible. The arrows in T point to ectopic bone growth on the mandible (ectopic bone growth observed in n = 3). The arrow heads in R point to the missing first arch elements. cb, ceratobranchials; ch, ceratohyal; e, ethmoid plate; hs, hyosymplectic; Mx, Maxilla, M, Mandible; m, Meckel’s cartilage; n, neurocranium; pp, pterygoid process; pq, palatoquadrate; Pmx, Pre-maxilla; Sq, Squamosal; t, trabeculae; v, viscerocranium. The scale bars represent 100 μm. |
| Fish: | |
|---|---|
| Observed In: | |
| Stage Range: | Day 4 to Day 6 |