
Fig. 2
- ID
- ZDB-FIG-190108-43
- Publication
- Meireles et al., 2018 - The Lysosomal Transcription Factor TFEB Represses Myelination Downstream of the Rag-Ragulator Complex
- Other Figures
- All Figure Page
- Back to All Figure Page
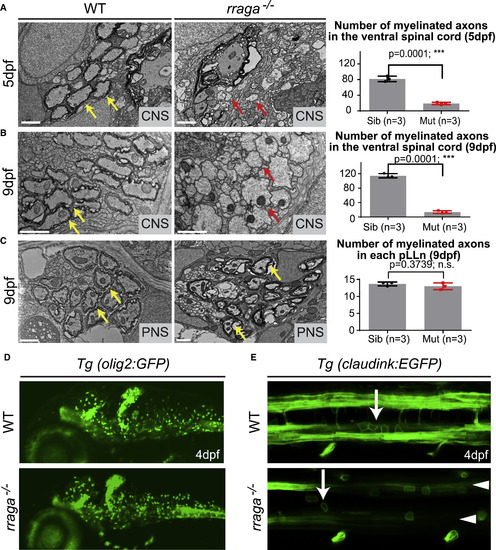
CNS Myelination Is Severely Reduced in rraga−/− Mutants although Oligodendrocytes Are Present (A and B) TEM images of transverse sections of the ventral spinal cord (CNS) at 5 dpf (A) and 9 dpf (B) show fewer myelinated axons in rraga−/− mutants (middle panel) compared to wild-type siblings (left panel). Quantification of the number of myelinated axons in the ventral spinal cord at 5 dpf and 9 dpf is shown on the right; bar graph depicts average values and standard error; individual measurements are also shown. (C) TEM images of transverse sections of the posterior lateral line nerve (pLLn) at 9 dpf show normal myelination in rraga−/− mutants (middle panel) compared to the wild-type sibling (left panel). Quantification of the number of myelinated axons in the pLLn at 9 dpf is shown on the right; bar graph depicts average values and standard error; individual measurements are also shown. In A–C, red arrows indicate unmyelinated axons, and yellow arrows indicate myelinated axons. 3 wild-type and 3 rraga−/− mutants were analyzed. Scale bar, 1 μm. (∗∗∗p < 0.001; Student’s t test, two-tailed). (D) Lateral view of 4 dpf Tg(olig2:EGFP) larvae showing comparable numbers of olig2-positive cells in both the wild-type (top panel) and rraga−/− mutant (lower panel); panel shows anterior to the left and dorsal up. See also Figure S2. (E) Dorsal view of 4-dpf Tg(claudink:EGFP) embryos showing presence of oligodendrocytes (arrows) in both wild-type (top panel) and rraga−/− mutants (lower panel) but reduced expression of GFP along myelinated axonal tracts (arrowheads). Panel shows anterior to the left and dorsal up. Genotypes of all animals shown were determined by PCR after imaging. |
| Genes: | |
|---|---|
| Fish: | |
| Anatomical Terms: | |
| Stage: | Day 4 |
Reprinted from Developmental Cell, 47, Meireles, A.M., Shen, K., Zoupi, L., Iyer, H., Bouchard, E.L., Williams, A., Talbot, W.S., The Lysosomal Transcription Factor TFEB Represses Myelination Downstream of the Rag-Ragulator Complex, 319-330.e5, Copyright (2018) with permission from Elsevier. Full text @ Dev. Cell