
Fig. 3
- ID
- ZDB-FIG-181207-52
- Publication
- Moeyaert et al., 2018 - Improved methods for marking active neuron populations
- Other Figures
- All Figure Page
- Back to All Figure Page
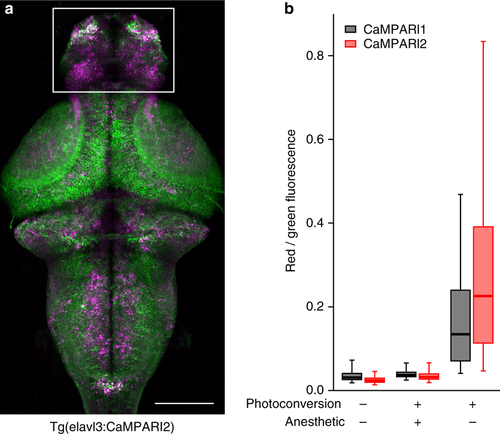
In vivo characterization of CaMPARI2 in zebrafish. a Representative z-projection from a confocal stack from a 6-dpf larval transgenic pan-neuronal CaMPARI2 zebrafish brain photoconverted for 30 s during free swimming. b Boxplots represent the distribution of red-to-green fluorescence signals from individual neurons (between 1800 and 6000 cells per condition, representing 2–4 fish (Supplementary Fig. 9, 10). Data are measured from neurons in the forebrain (white box in a) following photoconversion of either freely swimming or tricaine-anesthetized larval zebrafish. Box represents 1st, 2nd, and 3rd quartile, while whiskers represent the 5th and 95th percentile. Scale bar is 100 µm |