
Fig. 3
- ID
- ZDB-FIG-181130-9
- Publication
- Roussigné et al., 2018 - Left/right asymmetric collective migration of parapineal cells is mediated by focal FGF signaling activity in leading cells
- Other Figures
- All Figure Page
- Back to All Figure Page
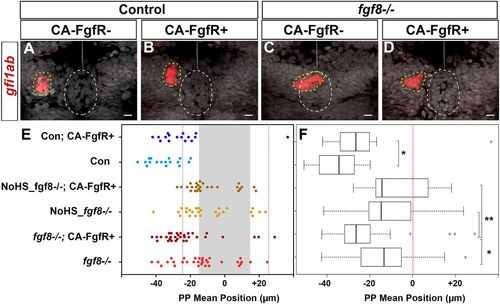
FgfR1 receptor activation partially restores parapineal migration in fgf8−/− mutants. (A–D) Confocal maximum projection (10 µm) showing gfi1ab expression (red) and cell nuclei (gray) in representative control embryos (A and B) and fgf8−/− mutants (C and D) that express CA-FgfR1 (B and D) or not (A and C); embryo view is dorsal, anterior is up. (Scale bars, 10 µm.) Control embryos are siblings of fgf8−/− mutants and thus correspond to both wild-type or fgf8+/− heterozygotes. gfi1ab expression marks the parapineal (yellow circle) while cell nuclei staining allows us to define the epiphysis (white circle) and the brain midline (straight dotted white line). (E) Dot plot showing, for each embryo, the mean parapineal position in micrometers distant to the brain midline (x = 0), at 52 hpf, in control embryos (Con, blue dots) and in fgf8−/− mutant embryos (fgf8−/−, red dots) that expressed (CA-FgfR+, dark color) or not (light color) CA-FgfR1 after a heat shock at 26 and 29 hpf; “NoHS_fgf8−/−;CA-FgfR+” and “NoHS_fgf8−/−” correspond to fgf8−/− mutants that do or do not carry the Tg(hsp70:ca-fgfr1) transgene but were not heat-shocked (dark and light yellow dots, respectively). Gray-shaded zone (−15 µm and +15 µm) define the “no migration” domain as corresponding to the average width of the epiphysis; gray dotted lines show −25 µm and +25 µm. (F) Boxplot showing the distribution of parapineal mean position relative to the brain midline (reference 0, red dotted line) in the same embryos. Parapineal mean position is shifted toward the midline in wild-type embryos expressing CA-FgfR1 (dark blue in E; n = 16) compared with control embryos that do not express CA-FgfR1 (light blue in E; n = 17); P = 0.023 (Wilcoxon test). The expression of CA-FgfR1 partially restores parapineal migration in fgf8−/− mutants (dark vs. light red in E; n = 32); P = 0.039. Parapineal mean position did not differ significantly between fgf8−/− mutants that do or do not carry the Tg(hsp70:ca-fgfr1) transgene but were not heat-shocked (dark versus light yellow in E; n = 26); P = 1 (see pairwise Wilcoxon test in SI Appendix, Table S1). Statistical significance is indicated in F, *P < 0.05, **P < 0.01. |