
Fig. S4
- ID
- ZDB-FIG-181116-57
- Publication
- Walton et al., 2018 - Cyclopropane Modification of Trehalose Dimycolate Drives Granuloma Angiogenesis and Mycobacterial Growth through Vegf Signaling
- Other Figures
- All Figure Page
- Back to All Figure Page
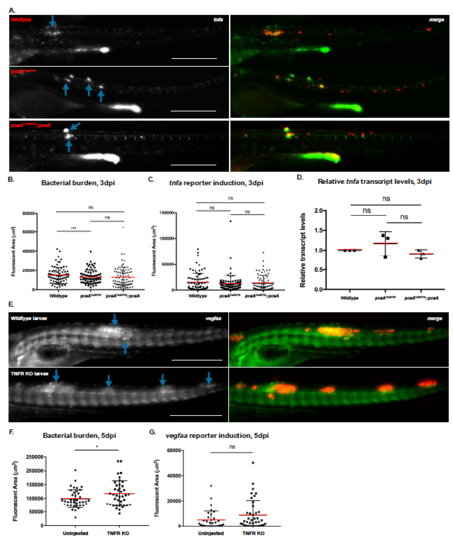
Vegf Pathway Activation during M. marinum Infection does not Require TNF Signaling. A. Representative images of TgBAC(tnf:GFP) larvae at 3 dpi infected with either wildtype (top), pcaA mutant (middle), or complemented mutant M. marinum (bottom). Blue arrows denote robust GFP expression in nascent granulomas indicative of tnfa transcriptional activation. Scale bars = 500m. B. Quantification of average bacterial burden for each infection group. C. Quantification of GFP signal. There were no significant differences on average among the groups, indicating similar levels of tnfa transcription at this timepoint; One-way ANOVA with Tukey’s multiple comparison posttest. N=78 for wildtype infections; N=79 for pcaA mutant infections; N=78 for complemented mutant infections. D. RT-qPCR assessment of relative tnfa transcript levels, normalized to wildtype levels. As with the TNF reporter data, no differences were observed between the infection groups. Data from 3 experiments combined. E. Representative images of wildtype (top) and mosaic CRISPR/Cas9-mediated TNFR knockout larvae (bottom), transgenic for TgBAC(vegfaa:EGFP) and infected with wildtype M. marinum, 5dpi. Blue arrows denote regions of robust GFP signal above background, indicating vegfaa transcriptional activation. Scale bars = 500m. F. Quantification of bacterial burden. The mosaic TNFR knockout group exhibited an increase in average bacterial burden at 5dpi, as has been previously observed for M. marinum infections of TNFR-deficient larvae. G. Quantification of GFP signal above background at 5dpi. GFP signal was not significantly different between either group, and in fact a trend of increasing signal in the mosaic knockout group was observed. *p<0.05; Student’s t-test. N=39 control larvae; N=40 TNFR KO larvae. |