
Fig. 2
- ID
- ZDB-FIG-181025-17
- Publication
- Ellett et al., 2018 - Macrophages protect Talaromyces marneffei conidia from myeloperoxidase-dependent neutrophil fungicidal activity during infection establishment in vivo
- Other Figures
- All Figure Page
- Back to All Figure Page
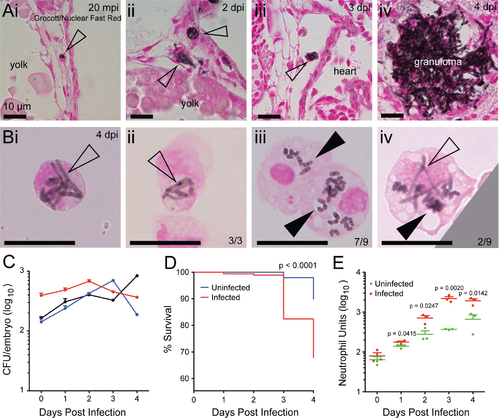
T. marneffei infection of zebrafish at 33°C. (Ai-iv) Histology of infected zebrafish embryos at different stages of T. marneffei infection. Sections were stained with Grocott methanamine silver to visualize fungi and counterstained with Nuclear Fast Red. Scale bar: 10 μm. (i) Phagocytosed conidium (arrowhead) within host leukocyte in the circulation at 20 minutes post infection. (ii) At 2 dpi, two fungal morphologies were observed: intracellular fungi assumed typical yeast morphology (upper arrowhead), while extracellular fungi displayed an elongated form (lower arrowhead). (iii) Yeast morphology of T. marneffei within a circulating infected leukocyte (arrowhead) at 3 dpi. (iv) Granuloma formation at 4 dpi. (B)FACS-purified, cytospun, T. marneffei-laden leukocytes prepared from infected embryos at 4 dpi, incubated at 33°C during infection. Grocott methanamine silver with Nuclear Fast Red counterstain. (i and ii) show neutrophils laden with hyphal forms (empty arrowheads), representative of all neutrophils observed. (iii) shows two macrophages laden with yeast forms (full arrowheads), the dominant morphology observed. (iv) shows a macrophage containing fungal cells of both yeast and hyphal morphologies. Scale bar: 10 μm. (C) Three representative CFU time-courses of infection at 33°C. In contrast to infections at 28°C (Fig 1D), no consistent decrease in CFU was observed at 4 dpi. Data are mean±SD of 3 independent replicates, n = 5 embryos (pooled)/timepoint/experiment. (D) Kaplan-Meier life table analysis for the treatment groups shown in (E). Significantly reduced survival occurred in infected groups compared to uninfected groups. n = 297 for uninfected, 319 for infected. P-value from Gerhan-Breslow-Wilcoxon Test. (E) Measurement of neutrophil populations during infection using Neutrophil Units. A significant increase in neutrophil population size occurred in the infected group compared to uninfected group over 1–4 dpi. Data are mean+SEM from 3 independent experiments. n = 5 embryos/group/timepoint in each experiment. P-values from unpaired two-tailed t-test. |
| Fish: | |
|---|---|
| Condition: | |
| Observed In: | |
| Stage Range: | Long-pec to Day 6 |