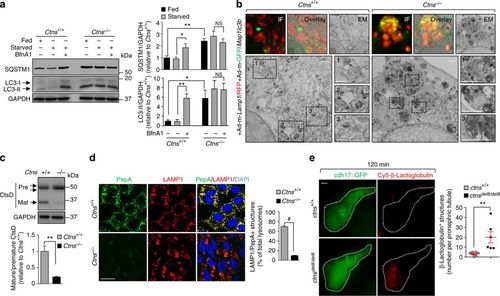
Cystinosin deficiency delays the clearance of autophagosomes by impairing lysosome function. a Western blotting and densitometric analyses for LC3 and SQSTM1 protein levels in Ctns mPTCs cultured in fed or starved medium in the presence or in the absence of 250 nM BfnA1 for 4 h (n = 3 independent experiments). Two-tailed unpaired Student’s t-test, **P < 0.01 (SQSTM1) and *P < 0.05 (LC3) relative to fed Ctns+/+ mPTCs, and *P = 0.05 (SQSTM1) and **P = 0.009 (LC3) relative to starved Ctns+/+ mPTCs. b Correlative light-electron microscopy (CLEM) in Ctns mPTCs co-transduced with RFP-tagged Lamp1 (LAMP1/RFP, red) GFP-tagged Map1lc3b (Map1lc3b/GFP, green) bearing adenoviral particles for 2 days. The colocalization of GFP-LC3 and RFP-LAMP1 was monitored by confocal microscopy. Selected cells were further processed and serial sections analysed by electron microscopy. Dotted black squares contain images at higher magnification. Scale bars are 2 μm (top panel) and 500 nm (bottom panel). c Western blotting and densitometric analyses of CtsD protein levels in Ctns mPTCs; two-tailed unpaired Student’s t-test, **P < 0.01 relative to Ctns+/+ mPTCs, n = 3 independent experiments. d Ctns mPTCs were loaded with Bodipy-FL-PepA (1 μM, for 1 h at 37 °C, green), immunostained with anti- LAMP1 antibody (red) and analysed by confocal microscopy. Quantification of numbers of PepA/LAMP1+ structures (in percentage of total lysosomes; n = 5 randomly selected fields per condition, with each containing ~ 20–25 cells; two-tailed unpaired Student’s t-test, #P < 0.0001 relative to Ctns+/+ mPTCs). e ctns zebrafish embryos expressing cdh17::GFP (green, pronephric tubule marker) were injected at 5 dpf with Cy5-tagged-β-lactoglobulin. At 120 min after the injection of the tracer, zebrafish embryos were imaged using light sheet fluorescent microscopy. A similar rate of internalization of Cy5-tagged-β-lactoglobulin was observed at 20 min in both ctns+/+ and ctnsdel8/del8 zebrafish embryos, validating the uptake of the tracer by pronephric tubules. Representative micrographs (left) and quantification (right) of numbers of β-lactoglobulin+ structures (red) in ctns zebrafish pronephric tubule (n = 6 zebrafish per group; two-tailed unpaired Student’s t-test, **P = 0.01 relative to ctns+/+ zebrafish). GAPDH was used as loading control in a and c. Plotted data represent mean ± SEM. Nuclei are counterstained with DAPI (blue). Yellow indicates colocalization. Scale bars are 10 μm in d and 50 μm in e
|
