
Fig. 4
- ID
- ZDB-FIG-181018-10
- Publication
- Du et al., 2018 - The Locus Coeruleus Modulates Intravenous General Anesthesia of Zebrafish via a Cooperative Mechanism
- Other Figures
- All Figure Page
- Back to All Figure Page
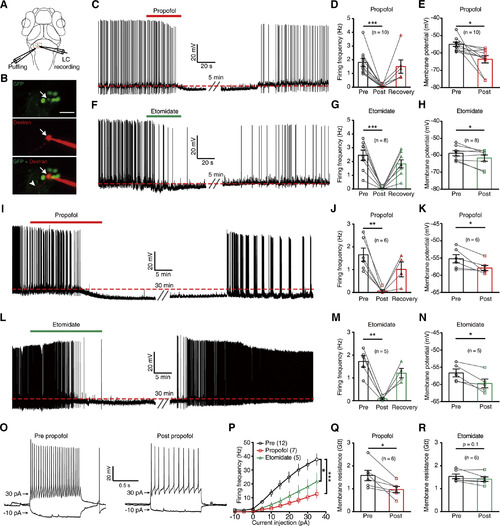
LC Neurons’ Excitability Is Suppressed by Intravenous Anesthetics (A) Schematic diagram showing whole-cell recording of LC neurons and simultaneous local puffing of anesthetic drugs onto the LC. (B) Confocal images showing the morphology of a recorded GFP-labeling LC neuron after loading Alexa Fluor 594 dextran into the cell (arrow) via the recording pipette in a 6 dpf ETvmat2:GFP larva. The arrowhead indicates the process of the recorded neuron. Scale bar, 20 μm. (C) Spontaneous spike firing of an LC neuron before and after puffing of propofol. The red dashed line indicates the mean resting membrane potential before propofol treatment. (D and E) Summary of data showing the effect of propofol treatment on the spontaneous spike frequency (D) and resting membrane potential (E) of LC neurons. Pre, before puffing; post, immediately after puffing; recovery, 10 min after puffing. (F) Spontaneous spike firing of an LC neuron before and after puffing of etomidate. (G and H) Summary of data showing the effect of etomidate treatment on the spontaneous spike frequency (G) and resting membrane potential (H) of LC neurons. (I–N) Effects of bath application of 30 μM propofol (I–K) or 30 μM etomidate (L–N) on spontaneous activities of LC neurons. (O) Representative traces showing LC neurons’ voltage responses evoked by current injections before (left) and immediately after (right) puffing of propofol. (P) Summary of data showing the effect of propofol (red) or etomidate (green) on current injection-evoked spike firing of LC neurons. (Q and R) Summary of data showing the effect of propofol (Q) or etomidate (R) on the membrane resistance of LC neurons. Numbers of cells examined are in parentheses. The two-tailed paired Student’s t test was performed for the data in (D), (E), (G), (H), (J), (K), (M), (N), (Q), and (R) and Kolmogorov-Smirnov test for the data in (P). n.s., not significant. ∗p < 0.05, ∗∗p < 0.01, and ∗∗∗p < 0.001. |