
Fig. 8
- ID
- ZDB-FIG-181011-16
- Publication
- Li et al., 2018 - Mutation in the intracellular chloride channel CLCC1 associated with autosomal recessive retinitis pigmentosa
- Other Figures
- All Figure Page
- Back to All Figure Page
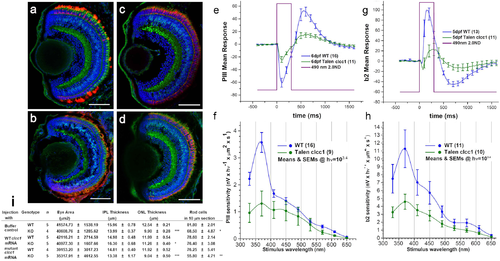
Retinal morphology and function is damaged in TALEN clcc1-KO zebrafish. (a-d) Merged photographs of frozen retinal sections prepared from the heads of 5 dpf larvae. Merged photos of frozen sections from KO (b, d) and WT (a, c) embryos stained for PKCß1 (bipolar cells, green), 4D2 (rod receptors, red, a and b), Zpr-1 (cone receptors, red, c and d), and DAPI (nuclei, blue). clcc1 KO embryos show destruction of the rod photoreceptor layer (b) compared with WT (a). While somewhat better preserved than in the morpholino clcc1 knockdown embryos, cone photoreceptors and the other retinal layers also appear decreased. (e) No background, 20mM sodium aspartate, mutant cone responses are 50% depressed relative to WT. (f) PIII 6dpf Talenclcc1 vs WT. Raw means and SEMs (all spectra). Dark adapted, no background. Cone spectral sensitivity is depressed about 60% in mutants. (g) No background, 50μM CNQX. For signals from ON bipolar cells, which are 2X more sensitive than cone signals, TALEN clcc1 mutant responses decrease by over 50%. Stimuli are saturating at 490nm. (h) b2 5dpf Talenclcc1 vs WT. Raw means and SEMs (all spectra). Dark adapted, no background. ON bipolar cell spectral sensitivity is depressed over 50% in mutants. Sensitivity axis is in units of nV per quantum as calculated from the amplitude of responses to constant quanta stimulation across the spectrum (Eq 1). The quanta level of 2500 hν·μm−2·s−1 at the cornea is below semi-saturation for all cone types. (i) coinjection of zebrafish embryos with WT but not p.D25E mutant clcc1 mRNA can rescue the KO phenotype. *p 0.022 vs. WT injected with buffer control, p = 0.0082 vs KO injected with p.D25E mutant clcc1 mRNA, ** p = 0.00095 vs. WT injected with buffer control *** p > 0.00012 vs. WT injected with buffer control. |
| Antibodies: | |
|---|---|
| Fish: | |
| Anatomical Terms: | |
| Stage: | Day 5 |
| Fish: | |
|---|---|
| Observed In: | |
| Stage Range: | Day 5 to Day 6 |