
Fig. 7
- ID
- ZDB-FIG-181004-28
- Publication
- Zielonka et al., 2018 - Pharmacologic rescue of hyperammonemia-induced toxicity in zebrafish by inhibition of ornithine aminotransferase
- Other Figures
- All Figure Page
- Back to All Figure Page
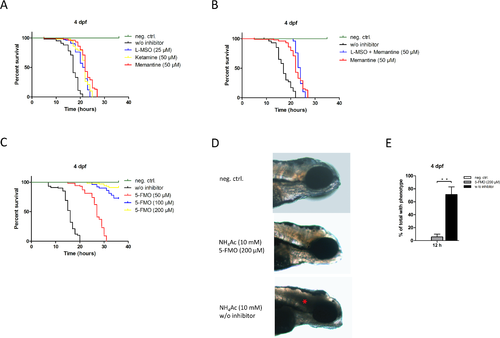
Comparison of different therapeutic concepts: OAT-inhibition prevents mortality in acute hyperammonemia and rescues brain cell death. Zebrafish larvae (n = 100 per group) at 4 dpf were treated with L-MSO (25 μM), ketamine (50 μM), or memantine (50 μM) alone or in combination or with increasing concentrations of 5-FMO (50 to 200 μM) for 30 minutes following exposure to 10 mM NH4Ac. While mock-treated zebrafish larvae died within 21 h (median survival: 17 h), larvae preincubated with L-MSO or ketamine succumbed to 10 mM NH4Ac within 24 h (median survival: 21.5 h; log-rank test, P<0.01) or 25 h (median survival: 22 h; log-rank test, P<0.01), respectively. Treatment with memantine prolonged survival up to 27 h (median survival 22h; log-rank test, P<0.01) (A). Combination of L-MSO and memantine did not further increase survival rates as compared to the treatment with memantine alone (B). Treatment with 50 μM 5-FMO for 30 min prior to NH4-exposure prolonged survival up to 31 h (median survival: 27 h; log-rank test, P<0.0001). Further dosage escalation had an incremental benefit on survival rates. While 72% of larvae treated with 100 μM 5-FMO survived the observation period of 36 h of NH4Ac exposure, treatment with 200 μM 5-FMO increased the survival rate of exposed larvae to 91% (C). Representative illustration of zebrafishes at 4 dpf either treated with 200 μM 5-FMO or mock (w/o inhibitor) for 30 min prior to exposure to 10 mM NH4Ac for 12 h (n = 3 with 50 larvae per group and experiment) (D). Zebrafishes were fixed with 5% PFA in PBS overnight and imaged using a binocular microscope (MZ16 F, Leica). Pictures show larvae with anterior to the right. Exposure to 10 mM NH4Ac induced brain cell death (asterix), which was rescued by treatment with 5-FMO in a concentration of 200 μM as compared to the non-exposed control cohort (D). Quantitative analysis of larvae exhibiting signs of brain damage in the different groups (E). Data are expressed as mean +/- SD in % of total exhibiting microscopic signs of brain cell death (n = 3 with 50 larvae per group and experiment; ANOVA, **P<0.01). |
| Fish: | |
|---|---|
| Conditions: | |
| Observed In: | |
| Stage: | Day 4 |