
FIGURE
Fig. 2
- ID
- ZDB-FIG-181003-31
- Publication
- Lapierre-Landry et al., 2018 - Imaging Melanin Distribution in the Zebrafish Retina Using Photothermal Optical Coherence Tomography
- Other Figures
- All Figure Page
- Back to All Figure Page
Fig. 2
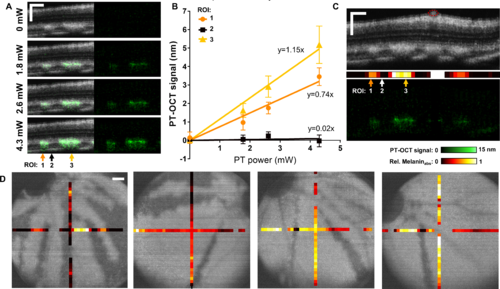
PT-OCT signal of melanin increases linearly with power and is indicative of melanin concentration. (A) OCT B-scans (grayscale, left) of a tyrosinase-mosaic zebrafish retina with corresponding PT-OCT signal (overlaid in green on the left, signal alone on the right) collected at the same location for different photothermal laser powers (0–4.3 mW). Example ROIs 1, 2, and 3 indicated by arrows. Each ROI is composed of 10 adjacent A-scans. (B) Average PT-OCT signal for each ROI as a function of photothermal laser power. Error bars: standard error across 10 adjacent A-scans. Linear fits for each ROI 1, 2, and 3 with equations y = 0.74x (R2 = 0.96, SSR = 0.24), y = 0.02x (R2 = −0.35, SSR = 0.05), and y = 1.15x (R2 = 0.98, SSR = 0.23), respectively. (C) OCT B-scan (top), melanin absorption bar corresponding to the slopes extracted in (B) (middle) and corresponding PT-OCT B-scan (bottom), with location of ROIs indicated by arrows. Red circles indicate blood vessels. (D) Melanin absorption bar overlaid onto en face OCT images of the RPE for four different eyes. Melanin absorption is normalized for each eye. ROIs where the PT-OCT signal did not behave as predicted by theory (slope < −0.1, R2 < 0.5 and SSR > 1) are excluded for the melanin absorption (empty space). Scale bar: 100 μm.
|
Expression Data
Expression Detail
Antibody Labeling
Phenotype Data
Phenotype Detail
Acknowledgments
This image is the copyrighted work of the attributed author or publisher, and
ZFIN has permission only to display this image to its users.
Additional permissions should be obtained from the applicable author or publisher of the image.
Full text @ Transl Vis Sci Technol