
Fig. S2
- ID
- ZDB-FIG-180913-26
- Publication
- Marsh et al., 2017 - Asymmetry of an Intracellular Scaffold at Vertebrate Electrical Synapses
- Other Figures
- All Figure Page
- Back to All Figure Page
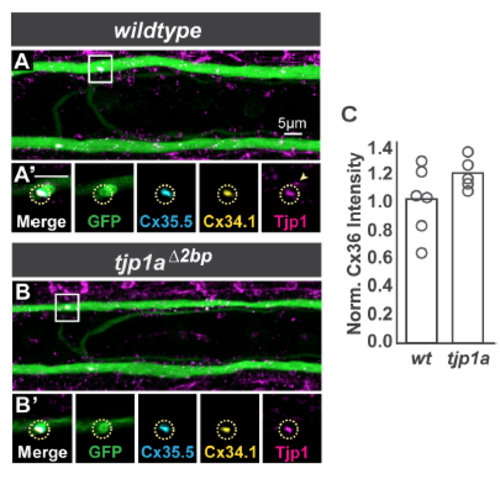
Homozygous loss of tjp1a does not affect electrical synapse formation. Related to Figure 2. A,B. Images are dorsal view projections of ~5 um of a spinal cord segment from M/CoLo:GFP larvae at 5 days post fertilization. Larvae are stained for anti-GFP (green), antizebrafish- Cx35.5 (cyan), anti-zebrafish-Cx34.1 (yellow), and anti-human Tjp1/ZO1 (magenta). Boxes denote location of zooms. A’,B’. Individual Z-plane zooms of indicated region. Yellow circle denotes location of M/CoLo site of contact. Individual channels are shown in neighboring panels. In tjp1a mutants, synaptic Cx and Tjp staining is unaffected (circles) but adjacent nonsynaptic staining (arrowhead in A’) is lost in the mutants (B’). C. Bar graphs represent the mean of Cx36 staining quantified at synapses with each circle representing the average of 11-16 M/CoLo synapses within an animal. See associated data and statistics in Data S1 and related data in Figure 2. |