
Fig. 4
- ID
- ZDB-FIG-180911-22
- Publication
- Guner-Ataman et al., 2018 - Failed Progenitor Specification Underlies the Cardiopharyngeal Phenotypes in a Zebrafish Model of 22q11.2 Deletion Syndrome
- Other Figures
- All Figure Page
- Back to All Figure Page
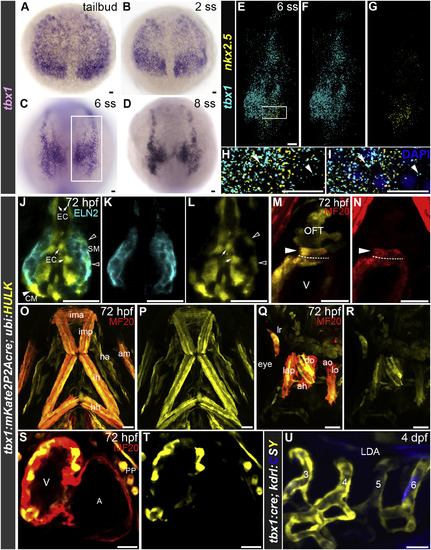
nkx2.5+ Progenitors in the ALPM of Zebrafish Embryos Co-express tbx1 (A–D) Bright-field images of wild-type embryos (n = 15 per stage) between tail bud and 8 somite stage (ss) processed by in situ hybridization with a tbx1 riboprobe. Boxed area in (C) shows region of embryo analyzed in (E)–(G). Dorsal views, anterior up. (E–I) Confocal z-stack of the tbx1 and nkx2.5 expression domains on the right side of a 6 ss wild-type embryo (n = 14) processed by RNAscope double-fluorescent in situ hybridization with tbx1 (pseudocolored cyan) and nkx2.5 (pseudocolored yellow) riboprobes. Merged double- (E) and single-channel (F and G) images are shown. Projection of selected z-stack images from the boxed region in (E) is shown at higher magnification in (H). A single section from (H) is shown in (I) (arrowheads are shown to indicate regions of overlap) with DAPI nuclei counterstaining. Dorsal views, anterior up. (J–T) Single optical sections (J–N, S, T) or confocal z-stacks (O–R) of the OFT (J–N), PA1- and PA2-derived HMs (O–R), and heart (S and T) in a 72 hpf Tg(tbx1:mKate2P2Acre), Tg(ubi:HULK) double-transgenic embryo co-immunostained with antibodies recognizing GFP (pseudocolored yellow) and OFT smooth muscle (Eln2; J–L; pseudocolored cyan, n = 15) or GFP (pseudocolored yellow) and striated muscle (MF20; M–T; red, n = 39) antibodies. Arrows, open arrowheads, and closed arrowheads point to GFP+ OFT endothelial cells (EC), OFT smooth muscle cells (SM), and OFT cardiomyocytes (CM) in (J), (L), and (M), respectively. Dashed lines demarcate the boundary between the ventricular and OFT myocardium in (M) and (N). Ventral views, anterior up (J–P, S, T). Lateral view, anterior left (Q and R). Merged (J, M, O, Q, S) and single (K, L, N, P, R, T)-channel images are shown. (U) Confocal z-stack of a 4 days post-fertilization (dpf) Tg(tbx1:mKate2P2Acre); Tg(kdrl:CSY) double-transgenic embryo (n = 22) showing expression of AmCyan and ZsYellow from the unrecombined and recombined reporter, respectively. Lateral view, anterior to the left. The numbers identify each PAA. In (J)–(N and (S)–(U), all of the animals contained some reporter expression in the structures shown, but the distribution within each structure was variable. In (O) and (P), little to no variation was observed in head muscle labeling between animals. In (A)–(I), little to no variation was observed between animals in each experimental group. Scale bars, 25 μm. PA1-derived head muscles: am, abductor mandibulae; do, dilator operculi; ima, intermandibularis anterior; imp, intermandibularis posterior; lap, levator arcus palatini; PA2-derived head muscles: ah, adductor hyoideus; ao, adductor operculi; ha, hypobranchial artery; hh, hyohyoidus; ih, interhyoidus; lo, levator operculi; lr, lateral rectus ocular muscle. A, atrium; LDA, lateral dorsal aorta; OFT, outflow tract; PP, parietal pericardium; V, ventricle. |