
Fig. 2
- ID
- ZDB-FIG-180829-7
- Publication
- Chen et al., 2018 - Comparative Study of Different Diets-Induced NAFLD Models of Zebrafish
- Other Figures
- All Figure Page
- Back to All Figure Page
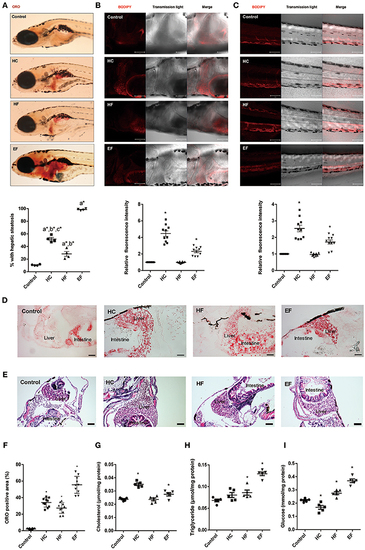
Assessment of lipid accumulation in zebrafish larvae. (A) The hepatic steatosis was observed by whole body ORO staining (A, below). The percent of larvae with hepatic steatosis was calculated from at least 100 fish each group. Data were representative of four independent experiments. (B) Showed fluorescent lipid accumulation deposits in the liver. Relative fluorescence intensities were quantified in the areas (n = 10). (C) Showed fluorescent lipid accumulation deposits in the blood vessel wall. Relative fluorescence intensities of the areas were quantified (n = 10). (D) Numerous lipid droplets in the hepatocytes were observed by ORO staining of frozen liver sections in HC, HF, and EF groups. The statistical results of positive area of ORO staining was showed in figure (F) (n = 10). (E) The lipid vacuoles were observed by H&E staining in HC, HF, and EF groups. Changes of cholesterol (G), triglyceride (H), and glucose (I) in livers of zebrafish larvae fed with control, HC, HF, and EF diets. Each sample were collected from 20 to 30 fish (n = 5). a, compared with control; b, compared with EF; c, compared with HF; *P < 0.05 vs. Control. Bar = 100 μm. |
| Fish: | |
|---|---|
| Conditions: | |
| Observed In: | |
| Stage: | Days 14-20 |