
Fig. S1
- ID
- ZDB-FIG-180823-34
- Publication
- Sloin et al., 2018 - Interactions between the circadian clock and TGF-β signaling pathway in zebrafish
- Other Figures
- All Figure Page
- Back to All Figure Page
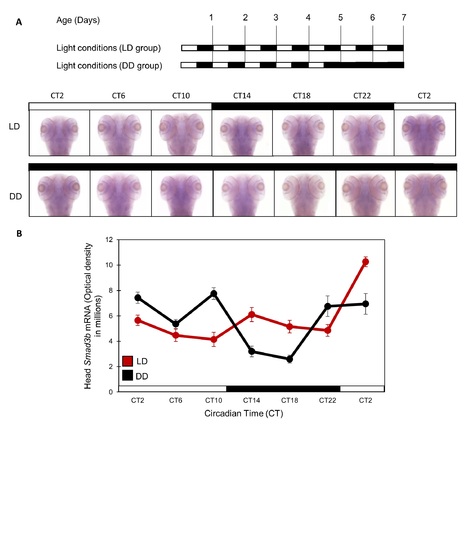
Smad3b mRNA does not show circadian expression in zebrafish larvae heads. Smad3b mRNA does not exhibit a circadian expression pattern in zebrafish larvae heads or other tissues. (A) Top panel: schematic representation of the experimental design. The horizontal bars represent the lighting conditions before and during sampling; white boxes represent light and black boxes represent dark periods. Bottom panel: Whole-mount ISH signals for Smad3b mRNA (dorsal views of the heads) of representative specimens raised under LD cycles until and during the sampling (LD group), or raised in DD during the sampling. Circadian times are indicated for each sample. CT0 corresponds to "subjective lights on", CT12 to "subjective lights-off". White bars represent light phases and black bars represent dark phases. (B) Quantification of signal intensities in the head of LD and DD larvae (n = 15/group). Values represent the mean ± SE optical densities of the head signals. White bars represent subjective day and black bars represent subjective night. |