
Fig. 3
- ID
- ZDB-FIG-180823-15
- Publication
- Mendelson et al., 2017 - The ceramide synthase 2b gene mediates genomic sensing and regulation of sphingosine Levels during zebrafish embryogenesis
- Other Figures
- All Figure Page
- Back to All Figure Page
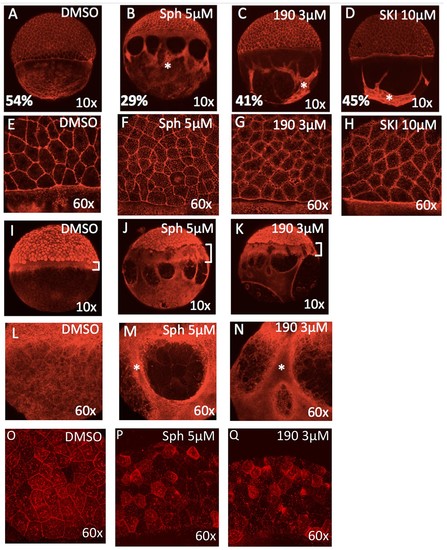
Excess sphingosine disrupts actin and microtubule organization and reduces junctional E-cadherin. (A) During gastrulation, actin accumulates at the vegetal pole as shown by phalloidin staining in DMSO-treated control embryos at ~50% epiboly (5.3 hpf). Phalloidin staining shows aggregation of thick F-actin positive bundles within the yolk cytoplasmic layer (YCL) of embryos treated with (B) 5 μM sphingosine, (C) 3 μM BT-190, or (D) 10 μM SKI (indicated by asterisks). For A-D, the average percent progression of the EVL is indicated as measured from the pole for a representative set of 5 embryos for each condition. (E–H) Shown at higher magnification, F-actin also accumulates within the cytoplasm of the enveloping cells in the treated embryos compared to DMSO-treated controls. During epiboly, two perpendicular microtubule layers are visible in DMSO-treated embryos at the YSL (I) and in the YCL (L). Staining with α-tubulin revealed a massively thickened microtubule layer within the YSL (as indicated by brackets, which also highlights the delayed progression of the EVL compared to deep layer cells) in embryos treated with (J) 5 μM sphingosine or (K) 3 μM BT-190 as well as (M,N) microtubule aggregation in certain areas of the YCL (denoted by asterisks) and other areas that are completely devoid of microtubules. Indicated by brackets in (I-K), the progression of the EVL appears to be more delayed compared to the deep cell layer. (O) DMSO-treated embryos display junctional E-cadherin staining of the EVL cells. (P,Q) Reduced junctional E-cadherin staining of the EVL cells and accumulation of staining within the EVL cytoplasm in embryos treated with 5 μM sphingosine or 3 μM BT-190. For all panels, representative embryos are shown, n is at least 100 from at least three independent experiments. |
| Fish: | |
|---|---|
| Conditions: | |
| Observed In: | |
| Stage: | 50%-epiboly |