
Fig. 1
- ID
- ZDB-FIG-180821-30
- Publication
- Ishimatsu et al., 2018 - Size-reduced embryos reveal a gradient scaling based mechanism for zebrafish somite formation
- Other Figures
- All Figure Page
- Back to All Figure Page
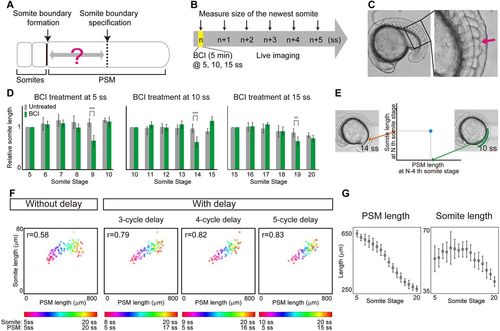
Somite scaling over time with time delay. (A) Schematic of time delay between somite boundary specification and somite boundary formation. (B) Schematic of the BCI experiment. Embryos were treated with BCI for 5 min and then subjected to live imaging in egg water without BCI. The BCI treatment was carried out at three different somite stages (5, 10, 15 ss), in case the delay time varies over time. (C) BCI-treated embryos form smaller somites (arrow). (D) Relative AP length of somites, normalized by the somite length of control embryos at the somite stage at which BCI treatment was carried out. At each somite stage, the smaller somite was formed four cycles after BCI treatment. Error bars denote s.d. **P<0.01; ***P<0.001 (n=5 for each condition). (E) Comparison of PSM length and somite length was made using PSM length at N−4 ss (e.g. 10 ss) and somite length at N ss (e.g. 14 ss), using live imaging data. (F) Somite size versus PSM size at different somite stages (indicated by the color scale) with and without time delay of three, four and five cycles (n=7). (G) Size dynamics of PSM and somites. Note that the peaks appear at different somite stages. n=7 each. Error bars denote s.d. |