
Fig. 4
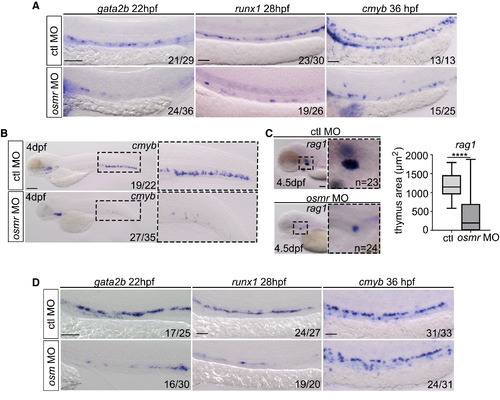
osmr Signaling Is Necessary for HSC Specification (A) gata2b, runx1, and cmyb ISH in control MO, or osmr MO-injected embryos (injected at 4 ng throughout, unless stated). Scale bar, 100 μm. ctl, control. (B) ISH expression of cmyb, in control MO, or osmr MO-injected embryos. Scale bar, 100 μm. (C) rag1 expression in the thymus after control MO or osmr MO injection, along with quantification of thymus area. Data are box and whiskers, min to max. Scale bar, 50 μm. (D) gata2b, runx1, and cmyb ISH in control MO, or osm MO (injected at 7 ng throughout, unless stated)-injected embryos. Scale bar, 100 μm. Data are boxes and whiskers, min to max. Statistical analysis was completed using an unpaired, two-tailed Student's t test. ∗∗∗∗p < 0.0001. |
| Genes: | |
|---|---|
| Fish: | |
| Knockdown Reagents: | |
| Anatomical Terms: | |
| Stage Range: | 26+ somites to Day 4 |
| Fish: | |
|---|---|
| Knockdown Reagents: | |
| Observed In: | |
| Stage Range: | 26+ somites to Day 4 |