FIGURE

Fig. S3

ID
ZDB-FIG-180802-23
Publication
Ahuja et al., 2018 - Overlapping but distinct topology for zebrafish V2R-like olfactory receptors reminiscent of odorant receptor spatial expression zones
Other Figures
All Figure Page
Back to All Figure Page
Fig. S3

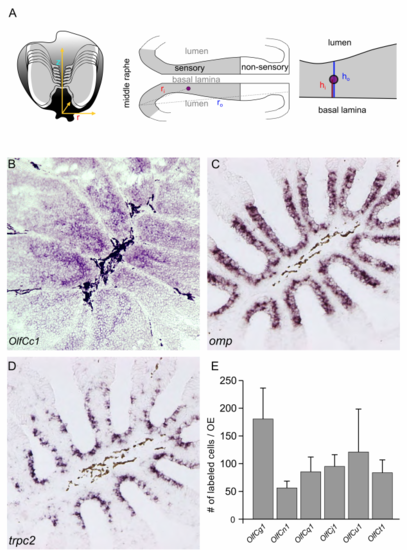
Quantitative in situ hybridisation of OlfC-expressing cells. (A-C) Comparison of OlfCc1 expression with that of olfactory neuron marker genes OMP and TRPC2. Labeled cells were exclusively detected in the sensory region of the adult olfactory epithelium. OlfCc1 distribution is similarly apical as TRPC2 and more apical than OMP, the marker for ciliated neurons. (D) Expression frequency for six different OlfC genes. The bar graphs represent the number of cells observed for a particular OlfC gene in the complete olfactory organ comprising 40–60 sections (mean +/− SEM, n = 3–5 olfactory organs). (PDF 12927 kb)

Expression Data
Genes:
Fish:
Anatomical Terms:
Stage: Adult

Expression Detail
Antibody Labeling
Phenotype Data

Phenotype Detail
Acknowledgments
This image is the copyrighted work of the attributed author or publisher, and ZFIN has permission only to display this image to its users. Additional permissions should be obtained from the applicable author or publisher of the image. Full text @ BMC Genomics