Fig. 5
- ID
- ZDB-FIG-180801-11
- Publication
- Berg et al., 2018 - Complementary expression of calcium binding proteins delineates the functional organization of the locomotor network
- Other Figures
- All Figure Page
- Back to All Figure Page
|
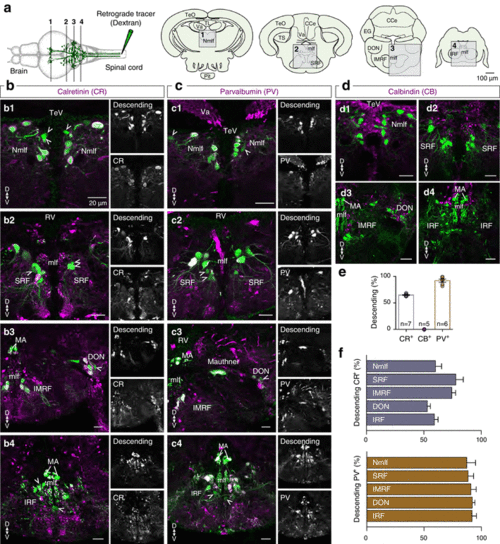
Distribution pattern of CR, CB and PV expression in reticulospinal neurons. a Schematic representation of the methodology used to reveal the brain neurons projecting to the spinal cord. The analyzed brain areas are indicated by boxes in coronal sections 1–4. b–d Microphotographs from coronal brain sections, showing the distribution of the brain neurons that project to the spinal cord (green) and the CR, CB and PV expression (magenta). Single channel views of the respective images shown for better visualization of the double-labeled neurons. Arrowheads indicate the double-labeled cells. e Percentage of the reticulospinal neurons that express CR, CB or PV, respectively. f Bar graph showing the percentage of brain to spinal cord projecting neurons in several brain areas that express CR or PV |

