
Fig. 3
- ID
- ZDB-FIG-180730-37
- Publication
- Haesemeyer et al., 2018 - A Brain-wide Circuit Model of Heat-Evoked Swimming Behavior in Larval Zebrafish
- Other Figures
- All Figure Page
- Back to All Figure Page
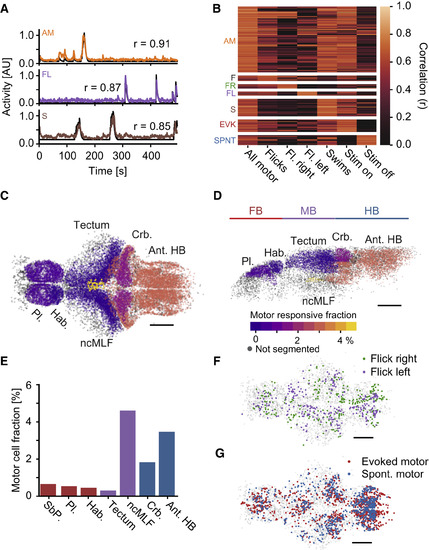
Motor Cells Can Be Separated According to Behavior and Stimulus Conditions (A) Example behavioral regressors (black) and activity trace of one correlated cell. Top: Cell encoding all motor events in a plane (orange); middle: cell encoding left flicks in a plane (purple); bottom: cell encoding swims in a plane (brown). Numbers indicate correlation coefficient. (B) Clustered heatmap of correlations of motor-cell activity with motor regressors, including the following events: All motor: all motor events of a given plane; Flicks: only flicks in a plane; Right/left flicks: only included right/left flicks; Swims: only swims included; Evoked motor: only motor events while the heat stimulus was on were included; Spontaneous motor: only motor events while the heat stimulus was off were included. Cells are only assigned to a more specialized motor cluster if the correlation to the specialized regressor is significantly higher than to the general regressor (p < 0.01, bootstrap hypothesis test). all-motor (AM): N = 5049 cells; flicks (F): N = 420; flick-right (FR): N = 319; flick-left (FL): N = 298; swims (S): N = 1338; evoked-motor (EVK): N = 950; spontaneous-motor (SPNT): N = 763. 30 fish. (C and D) Fraction of motor correlated cells within selected brain regions. Color scale indicates percentage of motor-correlated cells within each region. Scale bars, 100 μm. Pl.: pallium, Hab.: habenula, ncMLF: nucleus of the medial longitudinal fascicle, Crb.: cerebellum, Ant. HB: anterior hindbrain. Grey cells indicate brain regions that were not segmented. (C) Dorsal view of the brain, anterior left, left side bottom; (D) side view of left hemisphere, anterior left, dorsal top. (E) Quantification of percentage of motor correlated cells in select brain regions. Red bars: forebrain; purple: midbrain; blue: hindbrain. (F) Distribution of flick-right (green) and flick-left (purple) cells, top projection. Anterior left, scale bar, 100 μm G) Distribution of evoked-motor (red) and spontaneous-motor (blue) cells, top projection. Anterior left, scale bar, 100 μm. Grey cells in (F)–(G) are non-motor-related cells representing brain outline. See also Figure S3. |