
Fig. 4
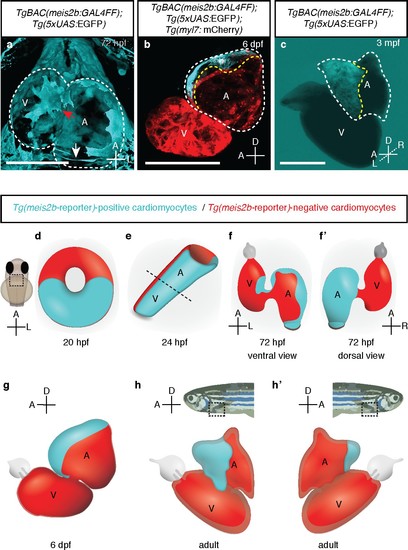
meis2b expression unveils an atrial asymmetry throughout development. (a) At 72 hpf, Tg(meis2b-reporter) expression is observed near the sinus venosus (white arrow), the dorsal and distal sides of the atrium, and a small part of the ventricle near the atrioventricular canal (red arrow) (n = 8) (Figure 4—video 1). (b) At 6 dpf Tg(meis2b-reporter) expression is found exclusively in the anterior-left compartment of the atrium at (n = 5) and in adult stages (c) in the left side of the atrium (n = 15) (Figure 4—video 2). (d-h’) Schematic of Tg(meis2b-reporter) expression throughout heart development [Tg(meis2b-reporter) expression in cardiomyocytes (cyan); meis2b-negative myocardium (red); (e) dotted line indicates the atrioventricular boundary]. (a, d–f) ventral views, anterior up; (b–c, g–h) lateral views, anterior to the left; (f’) dorsal view, anterior up; (h’) lateral view, anterior to the right. A, atrium; V, ventricle. (b–c) white dotted lines delineate the heart, yellow dotted lines delineate Tg(meis2b-reporter) expression. Scale bars: (a–b) 100 µm, (c) 500 µm. |
| Genes: | |
|---|---|
| Fish: | |
| Anatomical Terms: | |
| Stage Range: | Protruding-mouth to Adult |