
Fig. S5
- ID
- ZDB-FIG-180724-69
- Publication
- Jain et al., 2018 - A Forward Genetic Screen in Zebrafish Identifies the G-Protein-Coupled Receptor CaSR as a Modulator of Sensorimotor Decision Making
- Other Figures
- All Figure Page
- Back to All Figure Page
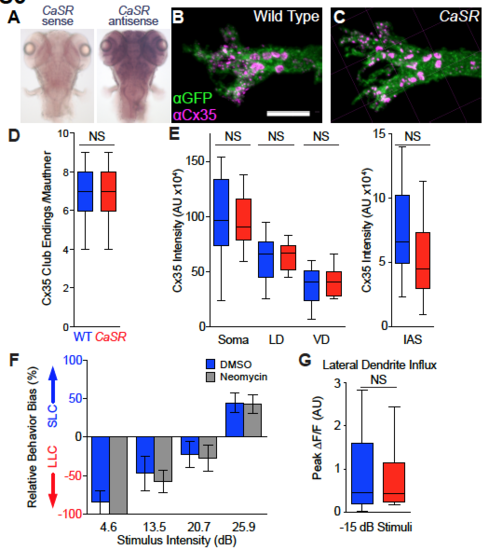
Impact of CaSR on Mauthner neuron synapses and synaptic influx, Related to Figure 3. (A) CaSR antisense probe in situ hybridization shows broad expression through the brain (104 hpf). (B-C) Confocal projection images of 144 hpf wild type sibling (A) and CaSR mutant Mauthner neuron lateral dendrites. Mauthner neurons labeled with Tg(hsp70:GAL4FFDMC)130a; Tg(UAS:gap43-citrine) transgene combination and stained with anti-GFP (αGFP, green) and anticonnexin 35 (αCx35, magenta). Scale bar indicates 10 μm. For clarity, labeling in both channels is shown following thresholding through Imaris software to eliminate non-Mauthner staining. (D-E) Quantification of αCx35 staining of Mauthner neurons from sibling (blue) and CaSR mutant (red) larvae including counts of large Club Ending synapses (C) and total αCx35 intensity on segmented Mauthner neuron surfaces (D). N= 15 wild type siblings and 12 CaSRp190 homozygous mutant neurons analyzed (see also Figure 3). (F) Relative behavioral bias of control larvae (DMSO, blue, N=23) and larvae treated with 40 μM neomycin (grey, N=13) to ablate lateral line sensory neuromasts, 6 dpf. (G) Peak ΔF/F in the Mauthner lateral dendrite following subthreshold acoustic stimuli (-15 dB) in head-restrained sibling (blue, N=29 stimuli) and CaSRp190 mutant (red, N=24 stimuli) larvae expressing GCaMP6s. Statistical comparison by student’s t-test (NS, p=0.395). |