
Fig. 6
- ID
- ZDB-FIG-180724-14
- Publication
- Janjuha et al., 2018 - Age-related islet inflammation marks the proliferative decline of pancreatic beta-cells in zebrafish
- Other Figures
- All Figure Page
- Back to All Figure Page
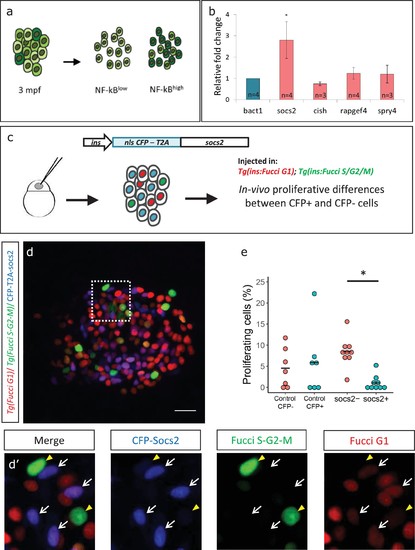
Socs2 is enriched in NF-kB:GFPhigh cells and inhibits beta-cell proliferation in a cell-autonomous manner. (a) Schematic showing the sorting of beta-cells from the double transgenic line Tg(ins:mCherry);Tg(NF-kB:GFP) at 3 mpf into GFPhigh and GFPlow cells using FACS. (b) Bulk RT-qPCR was performed on the GFPhigh and GFPlow beta-cells (n = 3 to 4 biological replicates, n = 3 animals per replicate, 1000 cells per condition). Candidate genes significantly enriched in beta-cells at 1 ypf were chosen to be compared between the GFPhigh and GFPlow populations at 3 mpf. The graph shows relative fold-change between GFPhigh and GFPlow cells. The expression of all genes was normalized to β-actin expression before calculating fold-change. socs2 shows higher expression in the GFPhigh cells. Error bars, SD (two-tailed paired t-test, *p<0.05). (c) Schematic showing the method for mosaic overexpression of candidate genes in beta-cells. The socs2 coding sequence is linked to nuclear-CFP using a T2A sequence. The entire construct was expressed under the insulin promoter. This construct was injected in one-cell-stage-embryos from Tg(ins:Fucci-G1);Tg(ins:Fucci-S/G2/M) animals leading to mosaic and stochastic expression of socs2 in beta-cells during islet development. Control animals were injected with plasmid containing only nuclear-CFP sequence (See Figure 6—figure supplement 2). (d) Confocal projections showing mosaic expression of socs2-T2A-CFP (blue) at 23 dpf (blue). Proliferating beta-cells are marked by Tg(ins:Fucci-S/G2/M) expression (green) and absence of Tg(ins:Fucci-G1) expression (red). Anterior to the left. Scale bar 10 µm. (d’) Insets show higher magnification single planes from the confocal stacks (white dotted-line in d) with separate channels. The proliferating beta-cells are CFP-negative (yellow arrowheads), whereas some of the non-proliferating cells are CFP-positive (white arrowheads) (e) Quantification of the percentage of Tg(ins:FUCCI-S/G2/M)-positive and Tg(ins:FUCCI-G1)-negative (green only) beta-cells. The socs2 expressing β-cells exhibit reduced cell-cycle progression compared to wild-type neighbors (n = 9). Horizontal bars represent mean values (two-tailed t-test, *p<0.05). |