
Fig. 2
- ID
- ZDB-FIG-180713-4
- Publication
- Almeida et al., 2018 - Myelination of Neuronal Cell Bodies when Myelin Supply Exceeds Axonal Demand
- Other Figures
- All Figure Page
- Back to All Figure Page
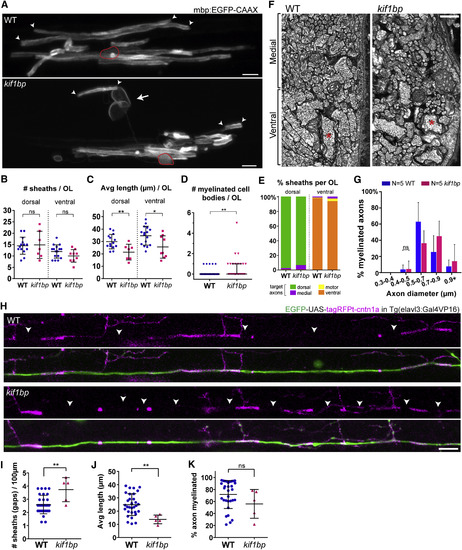
Individual Oligodendrocytes in Excess of Target Axons Wrap Cell Bodies and Normal Axon Targets, but Not Incorrect Axons (A) Individual oligodendrocytes (mbp:EGFP-CAAX+) in the 4 dpf anterior spinal cord. Arrow, myelinated cell body; arrowheads, normal myelin sheaths; red outline, oligodendrocyte cell body. (B) Sheath number per oligodendrocyte is normal (p = 0.868 dorsal, n = 14 WT and n = 7 mutants; p = 0.118 ventral, n = 16 WT and n = 9 mutants; t tests). (C) Average sheath length per oligodendrocyte is reduced in mutants (p = 0.007 dorsal, n = 14 WT and n = 7 mutants; p = 0.013 ventral, n = 16 WT and n = 9 mutants; t tests). (D) Number of myelinated cell bodies per oligodendrocyte is increased in mutants (p = 0.009, n = 35 WT and n = 25 mutants; Mann-Whitney test). (E) Proportion of myelin sheaths target axonal tracts in mutants is comparable to wild-type. (F) TEM at the onset of myelination (3.5 dpf) focusing on the ventral region with reticulospinal axons (e.g., asterisks) and adjacent medial region with small-diameter (<0.3 μm) unmyelinated axons. (G) The smallest myelinated axons remain above 0.4 μm diameter (p[0.4–0.5μm] = 0.908; p[0.5–0.7] = 0.251; p[0.7–0.9] = 0.386; p[0.9+] = 0.782; n = 5 WT and n = 5 mutants; corrected t tests). (H–J) Single EGFP+ reticulospinal axons (H) co-expressing the myelination reporter tagRFPt-cntn1a showing more and shorter tagRFPt-cntn1a gaps (i.e., myelin sheaths, arrowheads) in the anterior spinal cord of mutants at 4 dpf, quantified in (I) (p = 0.003; n = 31 WT and n = 5 mutants; t test), and (J) (p = 0.005; n = 31 WT and n = 5 mutants; t test). (K) % axon myelinated (tagRFPt-cntn1a negative) is comparable to wild-types (p = 0.174; n = 31 WT and n = 5 mutants; t test). All graphs display mean and SD, except (D) (median and interquartile range). The scale bars represent 5 μm (A), 0.5 μm (F), and 10 μm (H). |
| Gene: | |
|---|---|
| Fish: | |
| Anatomical Terms: | |
| Stage: | Day 4 |
| Fish: | |
|---|---|
| Observed In: | |
| Stage: | Day 4 |