|
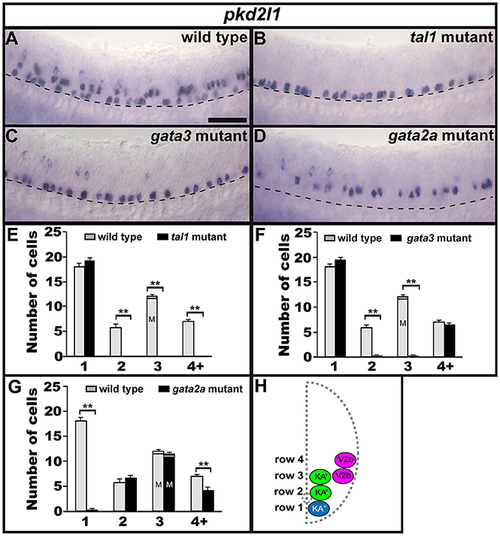
Expression of pkd2l1 in tal1, gata3, and gata2a mutants. Lateral views of pkd2l1 expression in 24 h WT sibling (A) and tal1 (B), gata3 (C), and gata2a (D) mutants. Dorsal, top; anterior, left. Scale bar = 50 microns. Dashed lines indicate ventral limit of spinal cord. The approximate proportions of medial and lateral row 3 cells are indicated by horizontal lines separating the number of medially-located cells (bottom and indicated with an “M”) from the number of laterally-located cells (top and indicated with a “L”). Mean number of cells expressing pkd2l1 in each D/V row of spinal cord region adjacent to somites 6–10 in WT and mutant embryos (E–G). All counts are an average of at least 4 embryos. Error bars indicate SEM. Statistically significant comparisons are indicated with brackets and stars. **P < 0.01. For P-values see Supplementary Table 3. Cross-sectional schematic indicating positions of KA″, KA′, and V2b neurons (H).
|