
Fig. S8
- ID
- ZDB-FIG-180706-49
- Publication
- Nagao et al., 2018 - Distinct interactions of Sox5 and Sox10 in fate specification of pigment cells in medaka and zebrafish
- Other Figures
- All Figure Page
- Back to All Figure Page
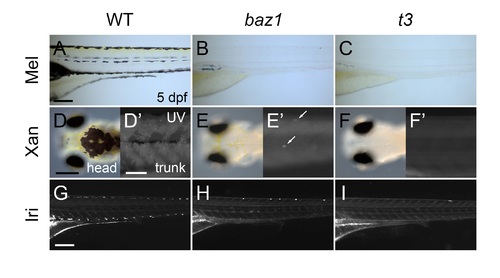
Zebrafish homozygous for the baz1 allele of sox10 show milder pigment cell phenotypes than those for t3 allele. (A, D, G) WT. (B, E, H) sox10baz1 mutant (baz1). (C, F, I) colourless/sox10t3 mutant (t3). (A-I) 5 dpf. (A-C, G-I) Lateral views of trunk. (D-F) Dorsal views. (D’-F’) UV images. Lateral views of trunk. WT zebrafish larva has four melanocyte stripes in the trunk (A). The baz1 (B) and t3 mutants (C) lack the stripes. In WT, xanthophores are widely distributed on dorsal surface of head (D). The baz1 mutant has a few xanthophores on head (E) and trunk (E’). The t3 mutant almost entirely lacks visible xanthophores (F, F’). Iridophores lie along the dorsal, ventral and yolk sac melanocyte stripes in WT (G). A few iridophores are found in the dorsal stripe and often in the lateral patches (B) in baz1 mutants (H). The t3 mutant almost completely lacks iridophores (I), but residual cells may be present in the lateral patches (C). Scale bars: (A, D, G) 200 μm, (E’) 100 μm. |
| Fish: | |
|---|---|
| Observed In: | |
| Stage: | Day 5 |