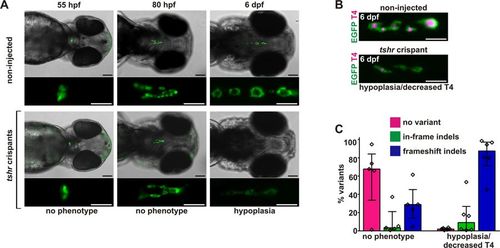
Recovery of hypoplastic/atrophic thyroid phenotypes in zebrafish tshr crispants. (A) Epifluorescence live imaging of Tg(tg:nlsEGFP) zebrafish. Ventral views of the head region (anterior to the right, scale bar: 100 µm) and magnified views of the thyroid region (GFP channel only, scale bar: 50 µm) are shown for non-injected controls and tshr crispants (target: exon 4) at 55 hpf, 80 hpf, and 6 dpf. No thyroid phenotypes were detectable at 55 hpf and 80 hpf but by 6 dpf, tshr crispants presented a hypoplastic/atrophic thyroid phenotype. (B) Whole-mount immunofluorescence staining of Tg(tg:nlsEGFP) zebrafish (6 dpf) for EGFP (thyroid cells) and thyroxine (colloidal T4). Epifluorescence imaging of the thyroid region in 6 dpf larvae (ventral views, anterior to the right, scale bar: 50 µm) revealed that thyroid hypoplasia in tshr crispants was accompanied by a reduction in thyroidal T4 content. (C) Distribution of allelic variants as determined by Illumina HiSeq analysis of individual tshr crispants revealed high mutagenesis efficiency in hypothyroid larvae presenting a hypoplastic thyroid. The percentage of WT alleles (no variant call), in-frame indels, or frameshift indels is shown for N = 4–6 larvae per phenotypic category (median values with interquartile range).
|
