
FIGURE
Fig. 1
- ID
- ZDB-FIG-180705-47
- Publication
- Coffey et al., 2018 - Ethanol Exposure Causes Muscle Degeneration in Zebrafish
- Other Figures
- All Figure Page
- Back to All Figure Page
Fig. 1
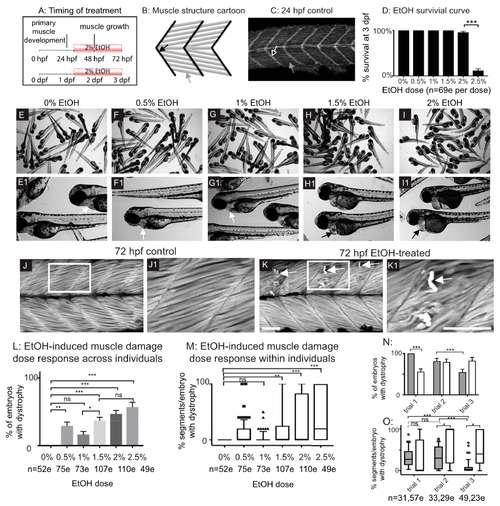
Late embryonic exposure to EtOH causes muscle damage in zebrafish. (A) Zebrafish muscle development timeline showing that 2% EtOH was administered after primary muscle development is complete. (B) Cartoon showing zebrafish muscle structure. Elongated myofibers (gray arrow) attach at the myotendinous junction (MTJ) (black arrow). (C) Control embryo. Muscle fibers have elongated (gray arrow) and attached to the MTJ (black arrow outlined in white) by 24 hpf. (D) Quantification of survival at 72 hpf following continuous treatment with one of six different doses of EtOH from 30 to 72 hpf. (E–I1) Brightfield images of 72 hpf zebrafish treated with one of six different doses of EtOH. Numbered panels are higher magnification images of zebrafish treated with the same EtOH dose as the corresponding lettered panels. (E–E1) 0% EtOH. Note normal heart morphology (E1, white arrow). (F–F1) 0.5% EtOH. Note normal heart morphology (F1, white arrow). (G–G1) 1% EtOH. Note normal heart morphology (G1, white arrow). (H–H1) 1.5% EtOH. Note pericardial edema (H1, black arrow). (I–I1) 2% EtOH. Note pericardial edema (I1, black arrow). (J–K1) Anterior left, dorsal-top, side-mounted, 72 hpf embryos stained with phalloidin (white) to visualize actin. White boxes in J and K correspond to zoomed-in, numbered panels J1 and K1, respectively. (J–J1) Control embryo. Muscle fibers remain attached to the MTJ. (K–K1) Embryo treated continuously with 2% EtOH from 30 to 72 hpf. White arrows indicate muscle fibers that have detached from the MTJ. (L) Quantification of the percent of EtOH-treated embryos at each of the EtOH treatment doses that displayed one or more fiber detachments. (M) Quantification of the percent of imaged segments with fiber detachments per embryo across the six different EtOH treatment doses. (N–O) Quantification of the variability in EtOH-induced fiber detachments across experimental replicates. (N) Percent of EtOH-treated embryos with at least one fiber detachment across three trials with either 2% EtOH diluted from 95% stock (gray bars) or 2% EtOH diluted from 100% stock (white bars). (O) Percent of imaged segments per embryo with fiber detachments across three trials with either 2% EtOH diluted from 95% stock (gray boxes) or 2% EtOH diluted from 100% stock (white boxes). Note the persistence of variability in muscle damage across three trials regardless of EtOH stock solution used. Scale bars are 50 micrometers. “e” = embryo. Error bars are standard error of the mean and whiskers are 10th–90th percentiles. * p < 0.05, ** p < 0.01, *** p < 0.001.
|
Expression Data
Expression Detail
Antibody Labeling
Phenotype Data
| Fish: | |
|---|---|
| Condition: | |
| Observed In: | |
| Stage Range: | Prim-15 to Protruding-mouth |
Phenotype Detail
Acknowledgments
This image is the copyrighted work of the attributed author or publisher, and
ZFIN has permission only to display this image to its users.
Additional permissions should be obtained from the applicable author or publisher of the image.
Full text @ J Dev Biol