
FIGURE
Fig. 1
- ID
- ZDB-FIG-180703-22
- Publication
- Lupperger et al., 2017 - Image analysis of neural stem cell division patterns in the zebrafish brain
- Other Figures
- All Figure Page
- Back to All Figure Page
Fig. 1
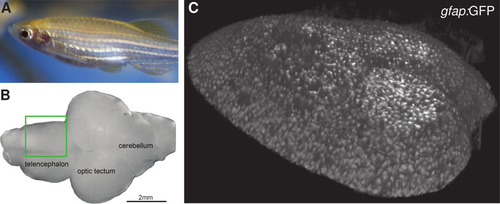
NSCs in the zebrafish telencephalon. (A) In all experiments, four‐month‐old zebrafish of a gfap:GFP transgenic strain were used, where green fluorescent protein (GFP) is expressed under the control of gfap enhancer elements. Average length of adult fish is ∼3 cm (B) Top view on a zebrafish brain showing the telencephalon, optic tectum, and cerebellum. We image one hemisphere of the telencephalon (marked with a green rectangle). Scale bar: 2 mm. (C) Reconstructed 3D image stack from confocal microscopy.
|
Expression Data
Expression Detail
Antibody Labeling
Phenotype Data
Phenotype Detail
Acknowledgments
This image is the copyrighted work of the attributed author or publisher, and
ZFIN has permission only to display this image to its users.
Additional permissions should be obtained from the applicable author or publisher of the image.
Full text @ Cytometry A