
Fig. 1
- ID
- ZDB-FIG-180627-27
- Publication
- Flanagan-Steet et al., 2018 - TGF-ß Regulates Cathepsin Activation during Normal and Pathogenic Development
- Other Figures
- All Figure Page
- Back to All Figure Page
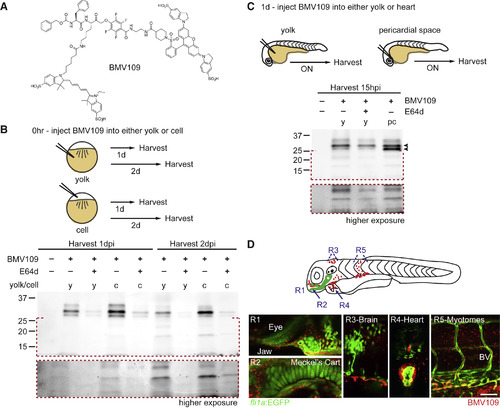
BMV109 Labels Cathepsin Proteases in Developing Zebrafish (A) BMV109 ABP structure. (B) Schematic of injection strategies. Shown are in-gel analyses of BMV109 reactivity. The bottom gel panels (outlined in red) are higher exposures of low-molecular-weight species; n = 4 experiments. For all gels, equivalence of protein loaded per lane was confirmed using the stain-free method (Experimental Procedures). (C) BMV109 was injected into the yolk or pericardial space of 1 dpf embryos and incubated overnight (15 hr); n = 4 experiments. (D) Live confocal analyses of 4 dpf fli1a:EGFP-positive embryos injected pericardially with BMV109 (red, imaging done 15 hr post injection [hpi]). The schematic shows 5 regions (R1–R5) spanning multiple embryonic tissues oriented head to tail. Meckel’s cartilage, lower jaw cartilage; BV, blood vessel. Scale bar, 10 μm. n = 30 embryos from 3 experiments. See also Figure S1. |