
Fig. 5
- ID
- ZDB-FIG-180621-87
- Publication
- Roberto et al., 2018 - Evidences for a New Role of miR-214 in Chondrogenesis
- Other Figures
- All Figure Page
- Back to All Figure Page
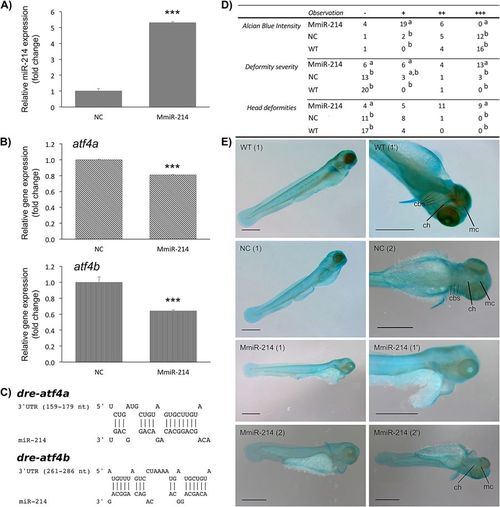
miR-214 ectopic expression downregulates atf4 transcripts and alters cranial cartilages of zebrafish. Larvae were microinjected at 1-cell stage with MmiR-214 or NC (18 μM) and analysed at 3 dpf. (A) Expression of miR-214 was determined by miRNA qPCR and normalized using U6 small RNA. (B) Expression of atf4a and atf4b in zebrafish larvae microinjected with MmiR-214 or NC. Levels of atf4a and atf4b transcripts expressions were determined by qPCR and normalized using 18 S ribosomal RNA housekeeping gene (similar results were obtained using ef1α housekeeping gene; data not shown). Results are presented as fold change over NC. Asterisks indicate values statistically different from NC (data are the mean ± s.d. of at least 3 independent replicates; Student’s t-test, ***p < 0.001). (C) Predicted miR-214 binding sites in zebrafish atf4a and atf4b 3′ UTRs. Zebrafish atf4a and atf4b transcripts sequences were collected from NCBI database and analysed using RNAhybrid. (D) Morphological alterations observed on 3 dpf embryos injected with MmiR-214 (n = 29) or NC (n = 21), and wild type (WT; n = 21), stained with alcian blue. Alcian blue intensity was classified as very weak (−), weak (+), normal (++) or intense (+++), while deformities present in the embryos were classified as absent/normal fish (−), low severity (+), severe (++), extremely severe (+++). Different letters indicate statistically significant differences between MmiR-214, NC and WT within the same classification (Chi-square test, p < 0.05). (E) Phenotype alterations observed in miR-214-injected embryos comparing to WT and NC-injected embryos, stained with alcian blue. Arrowheads indicate head deformations resulting from flattening of the mandible; arrows indicate differences on staining intensities of main cartilaginous structures (either absent or weak in miR-214-injected embryos). cbs, cerathobranchial cartilages; ch, ceratohyal; mc, Meckel’s cartilage. (1) or (2) indicate different embryos; (‘) indicate magnifications of the same embryo. Scale bar is 0.5 mm. |
| Genes: | |
|---|---|
| Fish: | |
| Anatomical Term: | |
| Stage: | Protruding-mouth |