
Fig. 4
- ID
- ZDB-FIG-180426-3
- Publication
- Ji et al., 2017 - Involvement of Lypge in the formation of eye and pineal gland in zebrafish
- Other Figures
- All Figure Page
- Back to All Figure Page
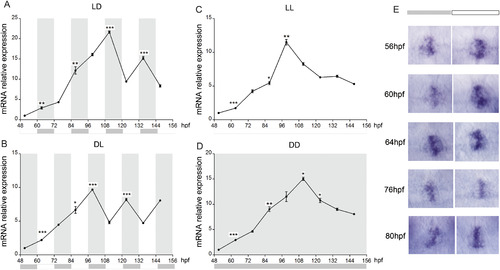
Assay for rhythmic Expression of lypge. (A–D) Expression is examined by qRT-PCR in different light-dark cycles (A: LD, B: DL, C: LL, D: DD). White and gray backgrounds represent light and dark phases. Zebrafish larvae were collected at two time points per day between 2 and 6 dpf. Embryos were sampled at zeitgeber time (ZT) 3 and 15. Statistically significant differences between the expression peak and through on each day (Fisher's t-test) are indicated:*P < 0.05, **P < 0.01, ***P < 0.001. Error bars indicate s.e.m. (E) Embryos are expose to continuous light or dark after 48 hpf and its expression in pineal gland is detected at different time. |
| Gene: | |
|---|---|
| Fish: | |
| Conditions: | |
| Anatomical Term: | |
| Stage Range: | Long-pec to Day 6 |
| Fish: | |
|---|---|
| Conditions: | |
| Observed In: | |
| Stage Range: | Long-pec to Day 6 |
Reprinted from Gene, 642, Ji, D., Wang, S., Li, M., Zhang, S., Li, H., Involvement of Lypge in the formation of eye and pineal gland in zebrafish, 491-497, Copyright (2017) with permission from Elsevier. Full text @ Gene