
Fig. S6
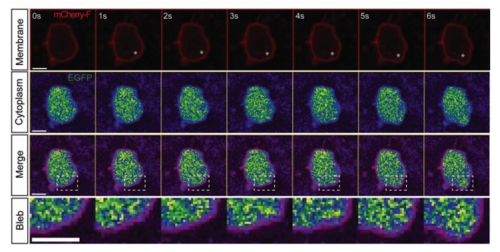
Cytoplamic flow during bleb formation. Related to Figure 1 Confocal image of a PGC labeled with farnesylated mCherry and cytoplasmic GFP. The asterisk in upper row marks the location of bleb inflation. The cytoplasmic GFP signal is presented in pseudocolors in the second row and third row presents an overlay of cytoplasm and membrane signals. Dashed rectangle marks the area of the forming bleb, magnified in the bottom (bleb) panel. Scale bar= 5µm. Similar observations were made in 13 cells and 38 blebs. The ratio between the cytoplasmic GFP signal intensity within the bleb divided by the prebleb cytoplasm signal intensity was not substantially different (median=0.98, interquartile range (0.91-1.03). |
Reprinted from Developmental Cell, 43(5), Goudarzi, M., Tarbashevich, K., Mildner, K., Begemann, I., Garcia, J., Paksa, A., Reichman-Fried, M., Mahabaleshwar, H., Blaser, H., Hartwig, J., Zeuschner, D., Galic, M., Bagnat, M., Betz, T., Raz, E., Bleb Expansion in Migrating Cells Depends on Supply of Membrane from Cell Surface Invaginations, 577-587.e5, Copyright (2017) with permission from Elsevier. Full text @ Dev. Cell