
Fig. 7
- ID
- ZDB-FIG-180420-33
- Publication
- Dogra et al., 2017 - Opposite effects of Activin type 2 receptor ligands on cardiomyocyte proliferation during development and repair
- Other Figures
- All Figure Page
- Back to All Figure Page
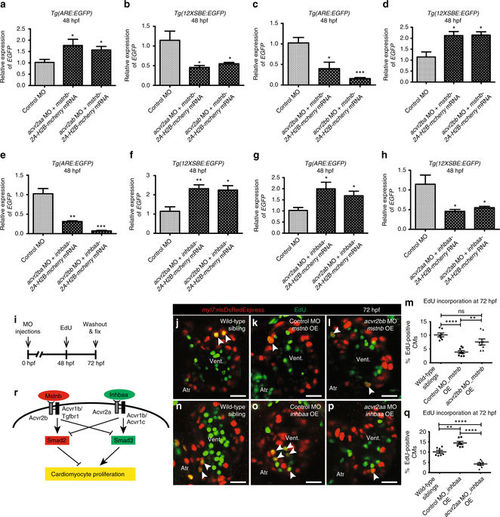
Mstnb and Inhbaa work through distinct Activin type 2 receptors to regulate CM proliferation. a–d RT-qPCR analysis for relative EGFP mRNA expression in 48 hpf Tg(ARE:EGFP) and Tg(12XSBE:EGFP) embryos injected with acvr2aa MO/mstnb-2A-H2B-mcherry mRNA, acvr2ab MO/mstnb-2A-H2B-mcherry mRNA, acvr2ba MO/mstnb-2A-H2B-mcherry mRNA, and acvr2bb MO/mstnb-2A-H2B-mcherry mRNA compared to control MO injected (n = 2 × 10 embryos assessed as two biological and two technical replicates). e–h RT-qPCR analysis for relative EGFP mRNA expression in 48 hpf Tg(ARE:EGFP) and Tg(12XSBE:EGFP) embryos injected with acvr2ba MO/inhbaa-2A-H2B-mcherry mRNA, acvr2bb MO/inhbaa-2A-H2B-mcherry mRNA, acvr2aa MO/inhbaa-2A-H2B-mcherry mRNA, and acvr2ab MO/inhbaa-2A-H2B-mcherry mRNA compared to control MO-injected (n = 2 × 10 embryos assessed as two biological and two technical replicates). i Experimental setup of injections, followed by EdU treatment and fixation. j–l Tg(myl7:nlsDsRedExpress) hearts of wild-type sibling, control MO-injected mstnb OE and acvr2bb MO-injected mstnb OE larvae at 72 hpf; α-DsRed (red), EdU (green). White arrowheads point to proliferating CMs (EdU+/DsRed+). m Quantification of CM proliferation in wild-type sibling (n = 7), control MO-injected mstnb OE (n = 8) and acvr2bb MO-injected mstnb OE (n = 8) ventricles at 72 hpf. n–p Tg(myl7:nlsDsRedExpress) hearts of wild-type sibling, control MO-injected inhbaa OE, and acvr2aa MO-injected inhbaa OE larvae at 72 hpf; α-DsRed (red), EdU (green). q Quantification of CM proliferation in wild-type sibling (n = 7), control MO-injected inhbaa OE (n = 7) and acvr2aa MO-injected inhbaa OE (n = 8) ventricles at 72 hpf. r Model of ligand-receptor relationship: Mstnb binds to Acvr2b, leading to the activation of Acvr1b/Tgfbr1, which promotes Smad2 and suppresses Smad3 activation. Inversely, Inhbaa binds to Acvr2a, recruiting Acvr1b/Acvr1c, thereby inducing Smad3 and suppressing Smad2 activation. This process is followed by the differential regulation of CM proliferation by Smad2 and Smad3. All cell counts were performed on non-overlapping confocal planes (thickness, 1 µm) (data are mean ± s.e.m., ns: no significant changes observed, *P ≤ 0.05, **P ≤ 0.01, ***P ≤ 0.001 and ****P ≤ 0.0001—Student’s t test, two-tailed). Scale bars, 20 µm. vent., ventricle; atr., atrium |
| Fish: | |
|---|---|
| Knockdown Reagents: | |
| Observed In: | |
| Stage: | Protruding-mouth |