
Fig. 1
- ID
- ZDB-FIG-180411-3
- Publication
- Mateos et al., 2017 - Correlative Super-resolution and Electron Microscopy to Resolve Protein Localization in Zebrafish Retina
- Other Figures
- All Figure Page
- Back to All Figure Page
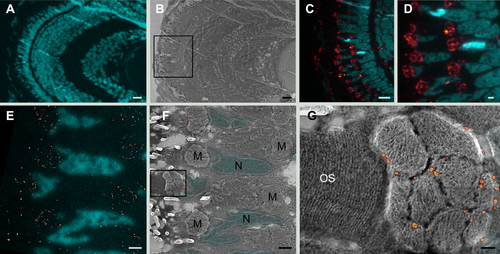
CLEM on zebrafish retina. A. Low magnification widefield image of a 5 dpf zebrafish retinal section, nuclei stained with DAPI (cyan). B. Scanning electron microscopy of the same area. C. Higher magnification widefield image of frame in B. Nuclei stained with DAPI (cyan) and Tom20 mitochondrial staining appears in red. D. Widefield image of same section at higher magnification. The pattern of Tom20 expression is at the clusters of mitochondria. E. Expression of Tom20 (red dots) detected by GSDIM microscopy. Nuclei stained with DAPI (cyan). F. Same section as E combining correlative super-resolution and scanning electron microscopy. Tom20 staining (red dots) appears at the mitochondrial cluster (M) at the outer membranes of mitochondria. Fluorescence DAPI signal in the nuclei (N) corresponds with the topography of the SEM image. G. High magnification image of frame in F. The scanning electron microscopy image provides context to the GSDIM image (red dots). Mitochondrial cristae are clearly visible and the Tom20 staining is localized to the outer membranes of mitochondria. The membranes of the outer segment the photoreceptors (OS) are clearly resolved. Image pixel size 5 nm. Scale bars: A, B, and C: 10 µm; D: 2 µm; E and F: 1 µm and G: 0.2 µm. |