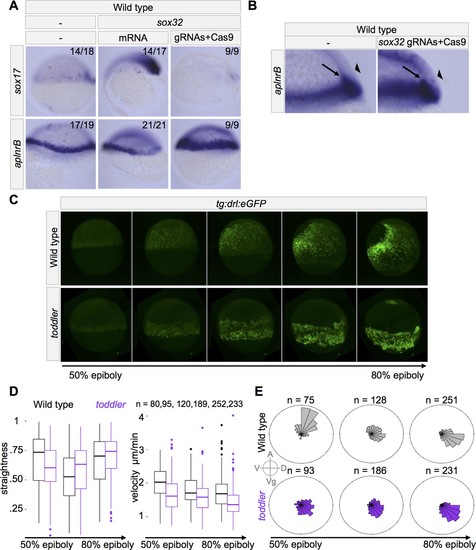
(A–B) Cas9-mediated mutagenesis was used to generate sox32 mutants. Embryos were injected at the one-cell stage either with sox32 mRNA or with Cas9 + sox32 gRNAs. in situ hybridization for sox17 and aplnrB at shield stage; dorsal to the right. (A) Expression of aplnrB decreases in the presence of excess endoderm and increases in the absence of endoderm. (B) Cross-section of shield stage embryo. The majority of cells expressing aplnrB in embryos lacking endoderm are internalized and unlikely to be ectodermal. Arrow: internalized cells. Arrowhead: ectoderm. (C–E) Mesodermal cell migration was tracked during gastrulation using a drl:eGFP transgene and lightsheet microscopy. drl:eGFP labels ventrolateral mesoderm during gastrulation. toddler mutant measurements represent three embryos. Wild-type measurements represent two wild-type and one heterozygous embryos. (C) Representative still frames of maximum intensity projections from a wild-type and toddler mutant drl:eGFP transgenic embryo. See also Video 1. (D–E) Movies spanning 50% to 85% epiboly were aligned at the onset of internalization and binned into 45 min windows. (D) Measurement of straightness and velocity of mesodermal cells in wild-type and toddler mutants. Straightness is defined as the difference between the total movement of a cell in all directions divided by the net displacement (the actual distance between the cell’s beginning and ending location). (E) toddler mutant cells have diminished migration animally during gastrulation. Each bin represents the proportion of cells moving in a given direction weighted by the total distance traveled in that direction. n = number of cells. A = animal, D = dorsal, Vg = vegetal, V = ventral.