
Fig. 3
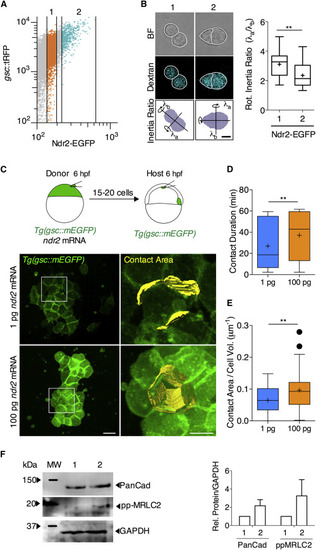
Nodal Signaling Promotes Prechordal Plate Cell-Cell Contact Formation In Vitro and In Vivo (A) FACS sorting strategy: mesendoderm (ppl) cells were obtained from 6 hpf Tg(gsc::tRFP) embryos injected with ndr2-EGFP mRNA at the one-cell stage and sorted into two groups according to Ndr2-EGFP expression levels. (B) Representative bright-field images of cell doublet shapes from the two groups. Cell doublet compaction was quantified as the ratio of rotational inertia along the longest and shortest axis. Values are shown as Tukey box-and-whisker plots with median (bar) and average (cross) values. n (1), 18, n (2), 35; 3 independent experiments. Scale bar, 5 μm. Statistical test, Student t test, two tailed. ∗∗p < 0.01. (C) Representative multi-photon images of mesendoderm progenitor cells transplanted from Tg(gsc::mEGFP) embryos injected with either 1 pg or 100 pg ndr2 mRNA into the animal pole of similar staged WT Tg(gsc::mEGFP) embryos. Transplantation was performed at shield stage (6 hpf), and images were taken between 65% epiboly stage (7 hpf) and 75% epiboly stage (8 hpf). Scale bar, 20 μm. (D) Average contact durations for mesendoderm cells expressing either low (1 pg) or high (100 pg) levels of ndr2. Cell-cell contacts were tracked for 60 min between 65% epiboly stage (7 hpf) and 75% epiboly stage (8 hpf). Values are shown as Tukey box-and-whisker plots with median (bar) and average (cross) values. n (1 pg), 72; n (100 pg), 82; 2 independent experiments each. Statistical test, Mann-Whitney t test, two tailed. ∗∗p < 0.01. (E) Average size of cell-cell contacts between mesendoderm progenitor cells expressing either low (1 pg) or high (100 pg) levels of ndr2 mRNA. Cell-cell contact area was measured 120 min after transplantation at 75% epiboly stage (8 hpf) and normalized on cell volume to account for variation due to cell size. Values are shown as Tukey box-and-whiskers plots with median (bar) and average values (cross). n (1 pg), 51; n (100 pg), 48; 2 independent experiments each. Statistical test, Mann-Whitney t test, two tailed. ∗∗p < 0.01. (F) Representative western blot showing the level of Pan-Cadherin (anti-PanCad antibody), phosphorylated myosin regulatory light chain 2 (anti-pp-MRLC2 antibody), and glyceraldehyde-3-phosphate dehydrogenase (anti-GAPDH antibody; control) expression in the two groups. PanCad/GAPDH and pp-MRLC2/GAPDH ratios were calculated after densitometry of 4 different experiments. See also Figure S2. |
Reprinted from Developmental Cell, 43(2), Barone, V., Lang, M., Krens, S.F.G., Pradhan, S.J., Shamipour, S., Sako, K., Sikora, M., Guet, C.C., Heisenberg, C.P., An Effective Feedback Loop between Cell-Cell Contact Duration and Morphogen Signaling Determines Cell Fate, 198-211.e12, Copyright (2017) with permission from Elsevier. Full text @ Dev. Cell