
FIGURE
Fig. 4
- ID
- ZDB-FIG-180321-32
- Publication
- Jones et al., 2017 - Expression and characterization of the zebrafish orthologue of the human FOLR1 gene during embryogenesis
- Other Figures
- All Figure Page
- Back to All Figure Page
Fig. 4
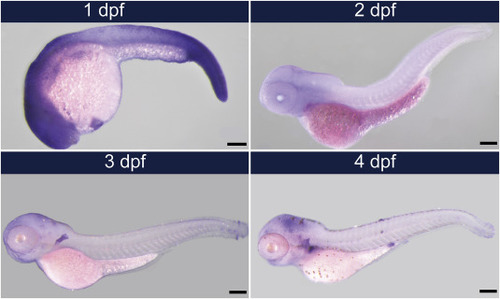
The expression of folr1 becomes restricted during and after segmentation. We observed folr1 expression become restricted to regions of known cell proliferation during and after somitogenesis. Of interest is the expression in the pectoral fin at 2dpf & the cloaca at 4dpf. Representatives images of n = 3 replicates where with each replicate having at least 15 embryos. dpf: days post-fertilization. |
Expression Data
| Gene: | |
|---|---|
| Fish: | |
| Anatomical Terms: | |
| Stage Range: | Prim-5 to Day 4 |
Expression Detail
Antibody Labeling
Phenotype Data
Phenotype Detail
Acknowledgments
This image is the copyrighted work of the attributed author or publisher, and
ZFIN has permission only to display this image to its users.
Additional permissions should be obtained from the applicable author or publisher of the image.
Reprinted from Gene expression patterns : GEP, 25-26, Jones, R.N., Erhard, S.A., Malham, M.R., Gen, A.Y., Sullivan, K., Olsen, K.W., Dale, R.M., Expression and characterization of the zebrafish orthologue of the human FOLR1 gene during embryogenesis, 159-166, Copyright (2017) with permission from Elsevier. Full text @ Gene Expr. Patterns