
Fig. 3
- ID
- ZDB-FIG-180313-16
- Publication
- Yanyi et al., 2017 - Activation of the Nkx2.5-Calr-p53 signaling pathway by hyperglycemia induces cardiac remodeling and dysfunction in adult zebrafish.
- Other Figures
- All Figure Page
- Back to All Figure Page
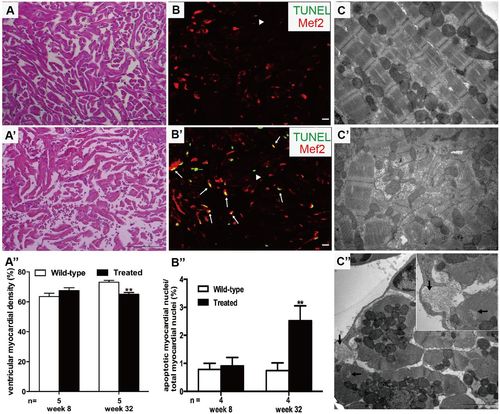
Hyperglycemia induced muscular disarray, myofibril loss and apoptosis activation. (A,A′) H&E staining of ventricle sections showed muscular disarray and myofibril loss in treated fish (A′) compared with the wild-type group (A) after 32 weeks of treatment (n=20 field, repeated five times); scale bars: 100 μm. (A″) Quantification analysis of ventricular myocardial density in H&E-stained hearts between the two groups in weeks 8 and 32. (B,B′) TUNEL (green)-stained sectioned ventricles co-stained with Mef2 (red) of wild-type (B) and treated (B′) fish in week 32 (n=20 field, repeated five times); scale bars: 10 μm. Arrows: TUNEL+/Mef2+; arrowheads: TUNEL+/Mef2−. (B″) Measurement of the ratio of apoptotic nuclei [yellow (green plus red)] to total myocardial nuclei (red) between the two groups in weeks 8 and 32. (C,C′) Longitudinal TEM image verified muscular disarray and myofibril loss detected in the hearts of the treated fish (C′) compared with that in the wild-type group (C) (n=20 field, repeated five times); scale bars: 2 μm. (C″) Transverse TEM image showed myofibril loss (arrows) in the hearts of treated fish. Inset is a higher magnification image. Scale bar: 2 μm. (A″,B″) Values are means±s.d. **P<0.01 compared with the wild-type group. n, number of fish examined. |
| Fish: | |
|---|---|
| Condition: | |
| Observed In: | |
| Stage: | Adult |