
Fig. 7
- ID
- ZDB-FIG-180308-4
- Publication
- Huang et al., 2017 - Epigenetic regulation of NOTCH1 and NOTCH3 by KMT2A inhibits glioma proliferation
- Other Figures
- All Figure Page
- Back to All Figure Page
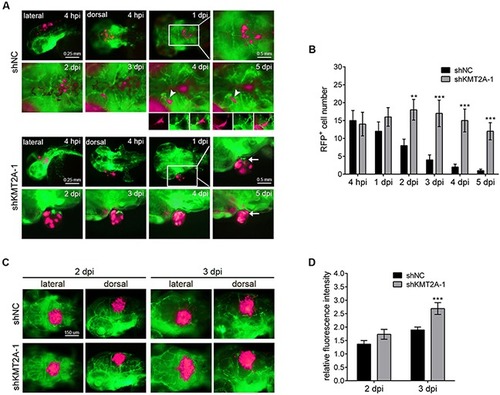
KMT2A knockdown promotes tumor growth in zebrafish
(A) U-87 MG cells were labeled with RFP (shown in fluorescent magenta), and approximately 50 cells were injected into the brains of Tg(fli1:egfp) fish in each experiment. Blood vessels are depicted by green fluorescent color. The transplanted zebrafish were imaged from 4 hours postimplantation (hpi) to 5 days postimplantation (dpi). Arrowheads depict tumor cells in the blood vessels, and arrows indicate the zebrafish blood vessels penetrating into the tumor tissues. (B) Quantification of transplanted cells. Quantification was performed by individually counting cells with red fluorescence (shown in fluorescent magenta), which indicated that the number of transplanted cells was significantly increased by KMT2A knockdown, compared with the control. shNC, scramble shRNA as negative control. (C) The immunosuppressant dexamethasone treatment increased the tumor growth. This result was quantified by measuring the red fluorescence intensity (D). **, p < 0.01; ***, p < 0.001. |
| Gene: | |
|---|---|
| Fish: | |
| Condition: | |
| Anatomical Term: | |
| Stage Range: | Long-pec to Days 7-13 |