
Fig. 3
- ID
- ZDB-FIG-180131-20
- Publication
- Lee et al., 2017 - Aggregation-prone GFAP mutation in Alexander disease validated using a zebrafish model
- Other Figures
- All Figure Page
- Back to All Figure Page
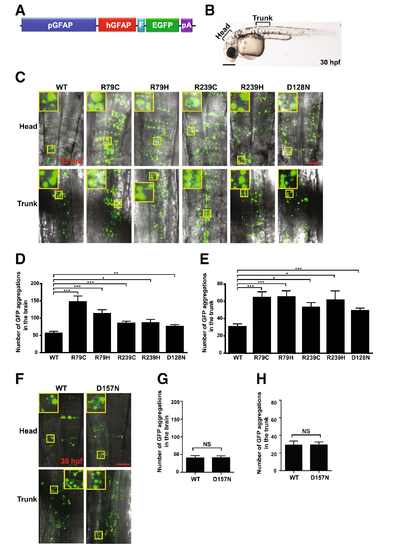
Aggregation susceptibility of mutant GFAPs can be assessed using zebrafish. a Schematic representation of an expression plasmid encoding human GFAP C-terminally fused to a FLAG epitope and EGFP driven by a zebrafish gfap promoter. EGFP: enhanced green fluorescent protein; F: 3× FLAG epitope tag; hGFAP: human GFAP; pA: polyadenylation sequence; and pGFAP: zebrafish gfap promoter. b Regions of zebrafish embryos at 30 h post-fertilization (hpf) imaged in (c). c One-cell stage zebrafish embryos were microinjected with expression plasmids encoding WT or indicated alleles of GFAP and imaged with a confocal laser microscope at 30 hpf. Images represent stacking of Z-series of images. Insets represent magnifications of the boxed areas. R79C: p.Arg79Cys; R79H: p.Arg79His; R239C: p.Arg239Cys; R239H: p.Arg239His; and D128N: p.Asp128Asn. Scale bar = 150 μm. d and e GFP aggregates, indicated by green dots, were counted in the brain (d) and trunk (e) regions of each group in (c). n = WT: 10; R79C: 9; R79H: 12; R239C: 15; R239H: 8; and D128N: 11. *: P < 0.05; **: P < 0.01; ***: P < 0.001. f Aggregation assays were performed with WT or D157N allele of GFAP as described in (c). Insets represent magnifications of the boxed areas. D157N: p. Asp157Asn. g and h GFP aggregates were counted as described in (d and e). NS, not significant. Scale bar = 150 μm |